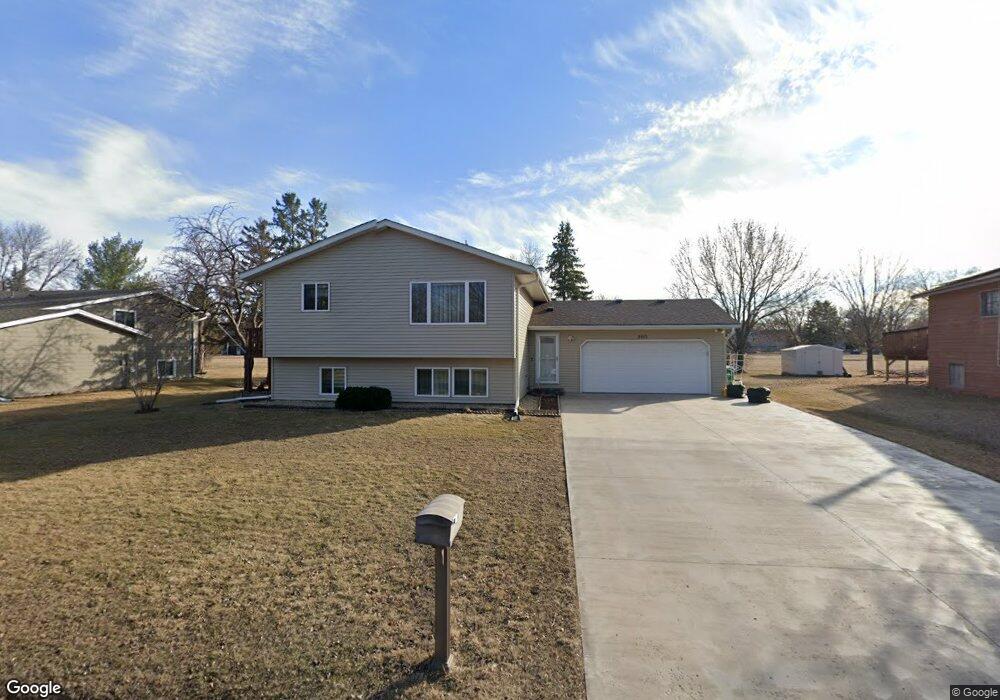
9915 Union Terrace Ln N Maple Grove, MN 55369
Estimated Value: $399,000 - $434,905
4
Beds
2
Baths
2,045
Sq Ft
$203/Sq Ft
Est. Value
About This Home
This home is located at 9915 Union Terrace Ln N, Maple Grove, MN 55369 and is currently estimated at $414,476, approximately $202 per square foot. 9915 Union Terrace Ln N is a home located in Hennepin County with nearby schools including Elm Creek Elementary School, Osseo Middle School, and Osseo Senior High School.
Ownership History
Date
Name
Owned For
Owner Type
Purchase Details
Closed on
Feb 7, 2022
Sold by
Prososki Rachel
Bought by
Konkin Vyacheslav
Current Estimated Value
Home Financials for this Owner
Home Financials are based on the most recent Mortgage that was taken out on this home.
Original Mortgage
$249,000
Outstanding Balance
$230,934
Interest Rate
3.45%
Mortgage Type
New Conventional
Estimated Equity
$183,542
Purchase Details
Closed on
Jan 17, 2022
Sold by
Prososki Rachel A
Bought by
Konkin Vyacheslav
Home Financials for this Owner
Home Financials are based on the most recent Mortgage that was taken out on this home.
Original Mortgage
$249,000
Outstanding Balance
$230,934
Interest Rate
3.45%
Mortgage Type
New Conventional
Estimated Equity
$183,542
Purchase Details
Closed on
Jul 13, 2007
Sold by
Wolff John W and Wolff Agnes E
Bought by
Prososki Rachel A
Create a Home Valuation Report for This Property
The Home Valuation Report is an in-depth analysis detailing your home's value as well as a comparison with similar homes in the area
Home Values in the Area
Average Home Value in this Area
Purchase History
| Date | Buyer | Sale Price | Title Company |
|---|---|---|---|
| Konkin Vyacheslav | $415,000 | -- | |
| Konkin Vyacheslav | $415,000 | Minnesota Title | |
| Prososki Rachel A | $214,000 | -- |
Source: Public Records
Mortgage History
| Date | Status | Borrower | Loan Amount |
|---|---|---|---|
| Open | Konkin Vyacheslav | $249,000 | |
| Closed | Konkin Vyacheslav | $249,000 |
Source: Public Records
Tax History Compared to Growth
Tax History
| Year | Tax Paid | Tax Assessment Tax Assessment Total Assessment is a certain percentage of the fair market value that is determined by local assessors to be the total taxable value of land and additions on the property. | Land | Improvement |
|---|---|---|---|---|
| 2024 | $4,372 | $370,100 | $116,000 | $254,100 |
| 2023 | $4,464 | $382,800 | $122,600 | $260,200 |
| 2022 | $3,389 | $351,300 | $97,600 | $253,700 |
| 2021 | $3,184 | $288,500 | $71,300 | $217,200 |
| 2020 | $3,082 | $268,600 | $57,300 | $211,300 |
| 2019 | $3,091 | $249,000 | $54,000 | $195,000 |
| 2018 | $2,895 | $237,200 | $53,000 | $184,200 |
| 2017 | $2,702 | $200,100 | $43,000 | $157,100 |
| 2016 | $2,748 | $200,600 | $48,000 | $152,600 |
| 2015 | $2,750 | $195,900 | $50,000 | $145,900 |
| 2014 | -- | $179,400 | $47,500 | $131,900 |
Source: Public Records
Map
Nearby Homes
- 9501 Revere Ln N
- 10924 101st Place N
- 10000 Nathan Ln N
- 9880 Cottonwood Ln N
- 6866 Zachary Ln N
- 10162 93rd Ave N
- 11043 104th Place N
- 9667 103rd Place N
- 9987 106th Place N
- 9201 Forestview Ln N
- 10781 Boundary Creek Terrace
- 14877 106th Ave N
- 9311 Kirkwood Ln N
- 9323 Kirkwood Ln N
- 9058 Goldenrod Ln N
- 9132 Kirkwood Ln N
- 225 4th Ave NE
- 9323 Magnolia Ln N
- 8864 Cottonwood Ln N
- 11760 88th Place N
- 9905 Union Terrace Ln N
- 9925 Union Terrace Ln N
- 9895 Union Terrace Ln N
- 9940 Union Terrace Ln N
- 9925 Trenton Ln N
- 9935 Union Terrace Ln N
- 9935 Trenton Ln N
- 9945 Union Terrace Ln N
- 9950 Union Terrace Ln N
- 9945 Trenton Ln N
- 9900 Trenton Ln N
- 9955 Union Terrace Ln N
- 9890 Trenton Ln N
- 9910 Trenton Ln N
- 9880 Trenton Ln N
- 9920 Trenton Ln N
- 9960 Union Terrace Ln N
- 9955 Trenton Ln N
- 9930 Trenton Ln N
- 10536 97th Place N