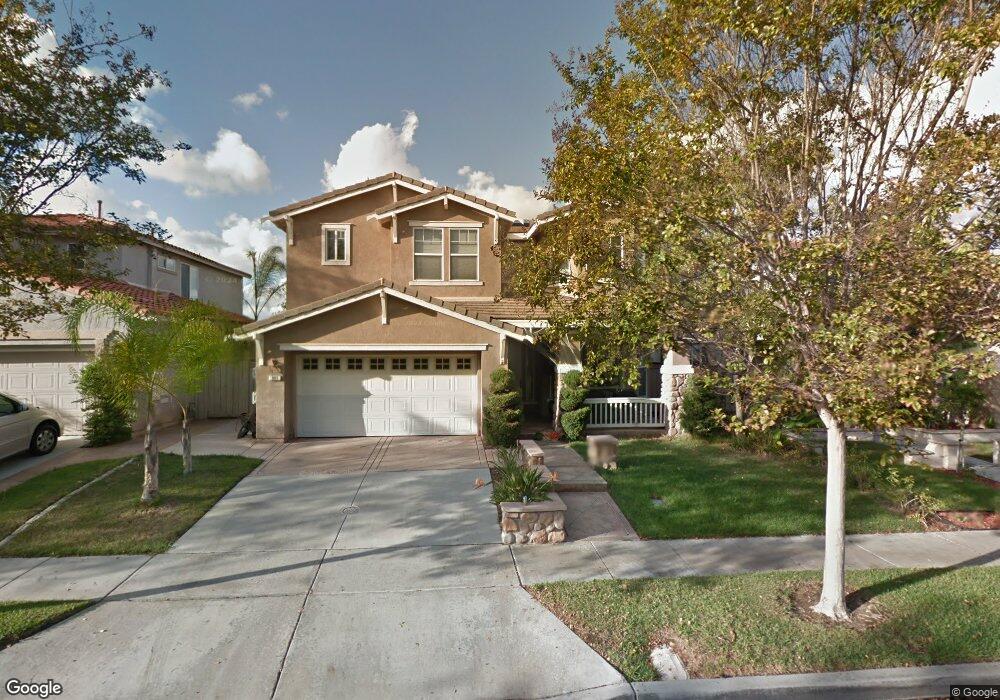
995 Strawberry Creek St Chula Vista, CA 91913
Otay Ranch NeighborhoodEstimated Value: $980,000 - $1,246,000
3
Beds
3
Baths
2,000
Sq Ft
$536/Sq Ft
Est. Value
About This Home
This home is located at 995 Strawberry Creek St, Chula Vista, CA 91913 and is currently estimated at $1,072,125, approximately $536 per square foot. 995 Strawberry Creek St is a home located in San Diego County with nearby schools including Anne & William Hedenkamp Elementary School, Rancho Del Rey Middle School, and Otay Ranch Senior High School.
Ownership History
Date
Name
Owned For
Owner Type
Purchase Details
Closed on
Sep 8, 2008
Sold by
Marlar Jon C and Marlar Shamaine T
Bought by
Espiritu Ernie and Espiritu Erica
Current Estimated Value
Home Financials for this Owner
Home Financials are based on the most recent Mortgage that was taken out on this home.
Original Mortgage
$329,011
Outstanding Balance
$218,524
Interest Rate
6.49%
Mortgage Type
FHA
Estimated Equity
$853,601
Purchase Details
Closed on
May 26, 2004
Sold by
Moss Sheldon Wayne and Moss Barbara Engel
Bought by
Marlar Jon C and Marlar Shamaine T
Home Financials for this Owner
Home Financials are based on the most recent Mortgage that was taken out on this home.
Original Mortgage
$476,000
Interest Rate
4.75%
Mortgage Type
Purchase Money Mortgage
Purchase Details
Closed on
Apr 9, 2003
Sold by
Rwr Otay Investors 49A Llc
Bought by
Moss Sheldon Wayne and Moss Barbara Engel
Home Financials for this Owner
Home Financials are based on the most recent Mortgage that was taken out on this home.
Original Mortgage
$351,200
Interest Rate
5.62%
Create a Home Valuation Report for This Property
The Home Valuation Report is an in-depth analysis detailing your home's value as well as a comparison with similar homes in the area
Home Values in the Area
Average Home Value in this Area
Purchase History
| Date | Buyer | Sale Price | Title Company |
|---|---|---|---|
| Espiritu Ernie | $335,000 | Chicago Title Company | |
| Marlar Jon C | $595,000 | Chicago Title Co | |
| Moss Sheldon Wayne | $439,000 | Chicago Title Co |
Source: Public Records
Mortgage History
| Date | Status | Borrower | Loan Amount |
|---|---|---|---|
| Open | Espiritu Ernie | $329,011 | |
| Previous Owner | Marlar Jon C | $476,000 | |
| Previous Owner | Moss Sheldon Wayne | $351,200 | |
| Closed | Marlar Jon C | $119,000 |
Source: Public Records
Tax History Compared to Growth
Tax History
| Year | Tax Paid | Tax Assessment Tax Assessment Total Assessment is a certain percentage of the fair market value that is determined by local assessors to be the total taxable value of land and additions on the property. | Land | Improvement |
|---|---|---|---|---|
| 2025 | $8,122 | $431,381 | $108,993 | $322,388 |
| 2024 | $8,122 | $422,923 | $106,856 | $316,067 |
| 2023 | $8,013 | $414,631 | $104,761 | $309,870 |
| 2022 | $7,846 | $406,502 | $102,707 | $303,795 |
| 2021 | $7,716 | $398,533 | $100,694 | $297,839 |
| 2020 | $10,291 | $394,448 | $99,662 | $294,786 |
| 2019 | $10,115 | $386,714 | $97,708 | $289,006 |
| 2018 | $9,995 | $379,133 | $95,793 | $283,340 |
| 2017 | $13 | $371,700 | $93,915 | $277,785 |
| 2016 | $6,894 | $364,413 | $92,074 | $272,339 |
| 2015 | $6,730 | $358,940 | $90,691 | $268,249 |
| 2014 | $6,831 | $351,910 | $88,915 | $262,995 |
Source: Public Records
Map
Nearby Homes
- 1337 Santa Olivia Rd
- 1175 Santa Olivia Rd
- 1156 Tristan River Rd
- 1124 Sparrow Lake Rd
- 843 Calle Ciela Vista Unit 20
- 843 De la Toba Rd
- 1369 Caminito de la Luna
- 793 Vada St Unit 2
- 1057 Paseo Del Norte
- 1340 Monte Sereno Ave
- 820 Chervil Ct
- 857 Cheyne Loop
- 761 De la Toba Rd
- 853 Cheyne Loop
- 1060 Via Sinuoso
- 1209 Morgan Hill Dr
- 801 Mateo St Unit 2
- Residence 2 Plan at Sunbow - Luna
- Residence 3 Plan at Sunbow - Soleil
- Residence 1 Plan at Sunbow - Luna
- 999 Strawberry Creek St
- 991 Strawberry Creek St
- 1003 Strawberry Creek St
- 987 Strawberry Creek St
- 1368 Santa Olivia Rd
- 1364 Santa Olivia Rd
- 1372 Santa Olivia Rd
- 1000 Strawberry Creek St
- 996 Strawberry Creek St
- 983 Strawberry Creek St
- 1360 Santa Olivia Rd
- 990 Strawberry Creek St
- 1380 Santa Olivia Rd
- 1376 Santa Olivia Rd
- 986 Strawberry Creek St
- 1356 Santa Olivia Rd
- 979 Strawberry Creek St
- 1020 Mccain Valley Ct
- 982 Strawberry Creek St
- 993 Mccain Valley Ct