T
Seller's Agent in 2025
The Awaka Group
Real Broker, LLC DBA Real
(720) 821-6766
8 in this area
471 Total Sales
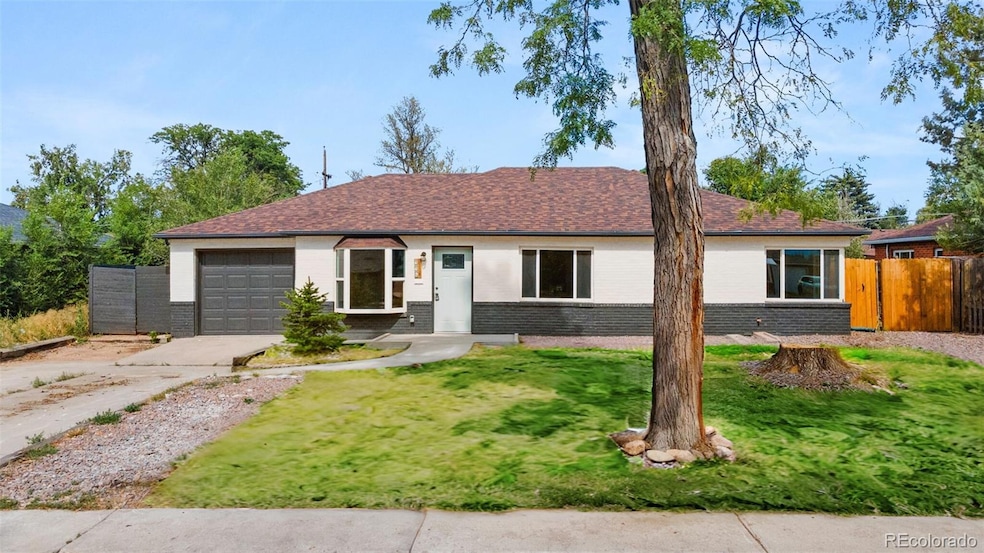


Welcome to 996 Quentin Street, a beautifully updated ranch-style home offering classic charm and modern comfort. This 3-bed, 2-bath gem features an open layout with new flooring, fresh paint, and abundant natural light. The remodeled kitchen includes new granite countertops, new cabinetry, and new stainless steel appliances, perfect for everyday living or entertaining. Both bathrooms have been updated with contemporary fixtures and tasteful tile work. Step outside to a spacious patio, ideal for relaxing or hosting guests. The home sits on a generous 8,450 sq ft lot with great curb appeal, an attached garage, central A/C, and forced-air heating. Located in the welcoming Jewell Heights–Hoffman Heights neighborhood, you’ll enjoy easy access to local schools, dining, and shopping. This move-in-ready home offers style, comfort, and convenience in one of Aurora’s most desirable areas. Don’t miss your chance to make 996 Quentin Street your new home.
Last Agent to Sell the Property
Real Broker, LLC DBA Real Brokerage Phone: 720-740-1058 Listed on: 07/25/2025

Co-Listed By
Real Broker, LLC DBA Real Brokerage Phone: 720-740-1058 License #100095055
| Date | Type | Sale Price | Title Company |
|---|---|---|---|
| Warranty Deed | $440,000 | Elite Title | |
| Warranty Deed | $320,000 | Chicago Title | |
| Warranty Deed | $89,192 | -- | |
| Warranty Deed | $60,000 | Land Title | |
| Warranty Deed | $66,000 | Land Title | |
| Deed | -- | -- | |
| Deed | -- | -- | |
| Deed | -- | -- |
| Date | Status | Loan Amount | Loan Type |
|---|---|---|---|
| Open | $210,000 | New Conventional | |
| Previous Owner | $71,353 | No Value Available | |
| Closed | $13,919 | No Value Available |
| Date | Event | Price | List to Sale | Price per Sq Ft |
|---|---|---|---|---|
| 08/26/2025 08/26/25 | Sold | $440,000 | -1.1% | $314 / Sq Ft |
| 08/02/2025 08/02/25 | Pending | -- | -- | -- |
| 07/25/2025 07/25/25 | For Sale | $445,000 | -- | $318 / Sq Ft |
| Year | Tax Paid | Tax Assessment Tax Assessment Total Assessment is a certain percentage of the fair market value that is determined by local assessors to be the total taxable value of land and additions on the property. | Land | Improvement |
|---|---|---|---|---|
| 2025 | $3,043 | $25,094 | -- | -- |
| 2024 | $2,478 | $26,659 | -- | -- |
| 2023 | $2,478 | $26,659 | $0 | $0 |
| 2022 | $2,164 | $21,552 | $0 | $0 |
| 2021 | $2,234 | $21,552 | $0 | $0 |
| 2020 | $2,152 | $20,671 | $0 | $0 |
| 2019 | $2,141 | $20,671 | $0 | $0 |
| 2018 | $1,120 | $17,791 | $0 | $0 |
| 2017 | $974 | $17,791 | $0 | $0 |
| 2016 | $611 | $13,007 | $0 | $0 |
| 2015 | $590 | $13,007 | $0 | $0 |
| 2014 | -- | $8,016 | $0 | $0 |
| 2013 | -- | $8,640 | $0 | $0 |
T
Seller's Agent in 2025
The Awaka Group
Real Broker, LLC DBA Real
(720) 821-6766
8 in this area
471 Total Sales
Seller Co-Listing Agent in 2025
Mahmoud Dumaidi
Real Broker, LLC DBA Real
(303) 618-2030
17 in this area
89 Total Sales
Buyer's Agent in 2025
Sonya Peterson
LIV Sotheby's International Realty
(303) 587-7969
2 in this area
59 Total Sales
Source: REcolorado®
MLS Number: 7809375
APN: 1973-01-3-07-007
Disclaimer: Certain information contained herein is derived from information provided by parties other than Homes.com. All information provided is deemed reliable, but is not guaranteed to be accurate and should be independently verified.
![]() Based on information submitted to the MLS GRID. All data is obtained from various sources and may not have been verified by broker or MLS GRID. Supplied Open House Information is subject to change without notice. All information should be independently reviewed and verified for accuracy. Properties may or may not be listed by the office/agent presenting the information. Some IDX listings have been excluded from this website. The content relating to real estate for sale in this Web site comes in part from the Internet Data eXchange (“IDX”) program of METROLIST, INC., DBA RECOLORADO®. Real estate listings held by brokers other than Ten-X are marked with the IDX Logo. This information is being provided for the consumers’ personal, non-commercial use and may not be used for any other purpose. All information is subject to change and should be independently verified.
Based on information submitted to the MLS GRID. All data is obtained from various sources and may not have been verified by broker or MLS GRID. Supplied Open House Information is subject to change without notice. All information should be independently reviewed and verified for accuracy. Properties may or may not be listed by the office/agent presenting the information. Some IDX listings have been excluded from this website. The content relating to real estate for sale in this Web site comes in part from the Internet Data eXchange (“IDX”) program of METROLIST, INC., DBA RECOLORADO®. Real estate listings held by brokers other than Ten-X are marked with the IDX Logo. This information is being provided for the consumers’ personal, non-commercial use and may not be used for any other purpose. All information is subject to change and should be independently verified.
This publication is designed to provide information with regard to the subject matter covered. It is displayed with the understanding that the publisher and authors are not engaged in rendering real estate, legal, accounting, tax, or other professional services and that the publisher and authors are not offering such advice in this publication. If real estate, legal, or other expert assistance is required, the services of a competent, professional person should be sought.
The information contained in this publication is subject to change without notice. METROLIST, INC., DBA RECOLORADO MAKES NO WARRANTY OF ANY KIND WITH REGARD TO THIS MATERIAL, INCLUDING, BUT NOT LIMITED TO, THE IMPLIED WARRANTIES OF MERCHANTABILITY AND FITNESS FOR A PARTICULAR PURPOSE. METROLIST, INC., DBA RECOLORADO SHALL NOT BE LIABLE FOR ERRORS CONTAINED HEREIN OR FOR ANY DAMAGES IN CONNECTION WITH THE FURNISHING, PERFORMANCE, OR USE OF THIS MATERIAL.
PUBLISHER’S NOTICE: All real estate advertised herein is subject to the Federal Fair Housing Act and the Colorado Fair Housing Act, which Acts make it illegal to make or publish any advertisement that indicates any preference, limitation, or discrimination based on race, color, religion, sex, handicap, familial status, or national origin.
METROLIST, INC., DBA RECOLORADO will not knowingly accept any advertising for real estate that is in violation of the law. All persons are hereby informed that all dwellings advertised are available on an equal opportunity basis.
© 2026 METROLIST, INC., DBA RECOLORADO® – All Rights Reserved. 6455 S. Yosemite St., Suite 500 Greenwood Village, CO 80111 USA
ALL RIGHTS RESERVED WORLDWIDE. No part of this publication may be reproduced, adapted, translated, stored in a retrieval system or transmitted in any form or by any means, electronic, mechanical, photocopying, recording, or otherwise, without the prior written permission of the publisher. The information contained herein including but not limited to all text, photographs, digital images, virtual tours, may be seeded and monitored for protection and tracking.
Based on information submitted to the MLS GRID
Ask me questions while you tour the home.