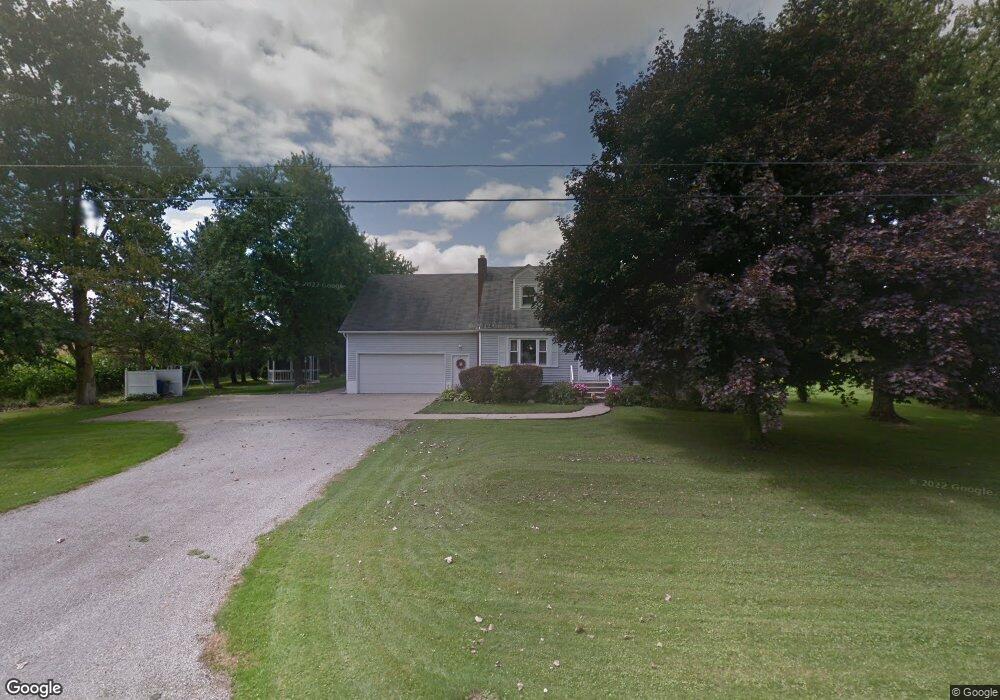
9976 Gifford Rd Amherst, OH 44001
Estimated Value: $326,662 - $445,000
5
Beds
3
Baths
3,118
Sq Ft
$122/Sq Ft
Est. Value
About This Home
This home is located at 9976 Gifford Rd, Amherst, OH 44001 and is currently estimated at $380,666, approximately $122 per square foot. 9976 Gifford Rd is a home located in Lorain County with nearby schools including Firelands Elementary School, Firelands Middle School, and Firelands High School.
Ownership History
Date
Name
Owned For
Owner Type
Purchase Details
Closed on
Sep 18, 2019
Sold by
Callahan Paul W and Callahan Ann M
Bought by
Knoble Joseph R and Knoble Tanya S
Current Estimated Value
Purchase Details
Closed on
Jan 9, 2019
Sold by
Callahan Paul W and Callahan Anne M
Bought by
Knoble Joseph R and Knoble Tanya S
Home Financials for this Owner
Home Financials are based on the most recent Mortgage that was taken out on this home.
Original Mortgage
$171,000
Outstanding Balance
$150,948
Interest Rate
4.8%
Mortgage Type
New Conventional
Estimated Equity
$229,718
Purchase Details
Closed on
Aug 28, 1995
Sold by
Knoble Mary D
Bought by
Callahan Paul W and Callahan Anne M
Home Financials for this Owner
Home Financials are based on the most recent Mortgage that was taken out on this home.
Original Mortgage
$105,000
Interest Rate
7.43%
Mortgage Type
New Conventional
Create a Home Valuation Report for This Property
The Home Valuation Report is an in-depth analysis detailing your home's value as well as a comparison with similar homes in the area
Home Values in the Area
Average Home Value in this Area
Purchase History
| Date | Buyer | Sale Price | Title Company |
|---|---|---|---|
| Knoble Joseph R | -- | Fidelity National Title | |
| Knoble Joseph R | $190,000 | Fidelity Natl Title Co Llc | |
| Callahan Paul W | $105,000 | -- |
Source: Public Records
Mortgage History
| Date | Status | Borrower | Loan Amount |
|---|---|---|---|
| Open | Knoble Joseph R | $171,000 | |
| Closed | Callahan Paul W | $105,000 |
Source: Public Records
Tax History Compared to Growth
Tax History
| Year | Tax Paid | Tax Assessment Tax Assessment Total Assessment is a certain percentage of the fair market value that is determined by local assessors to be the total taxable value of land and additions on the property. | Land | Improvement |
|---|---|---|---|---|
| 2024 | $3,226 | $74,109 | $5,901 | $68,208 |
| 2023 | $2,433 | $49,721 | $6,020 | $43,701 |
| 2022 | $2,349 | $49,721 | $6,020 | $43,701 |
| 2021 | $2,347 | $49,721 | $6,020 | $43,701 |
| 2020 | $2,127 | $42,940 | $5,200 | $37,740 |
| 2019 | $2,112 | $42,940 | $5,200 | $37,740 |
| 2018 | $2,163 | $42,940 | $5,200 | $37,740 |
| 2017 | $1,928 | $39,430 | $6,310 | $33,120 |
| 2016 | $1,943 | $39,430 | $6,310 | $33,120 |
| 2015 | $1,944 | $39,430 | $6,310 | $33,120 |
| 2014 | $1,868 | $37,310 | $5,970 | $31,340 |
| 2013 | $1,824 | $37,310 | $5,970 | $31,340 |
Source: Public Records
Map
Nearby Homes
- Lot B Gifford Rd
- 9839 Gifford Rd
- 48375 Telegraph Rd
- 11135 Baumhart Rd
- 402 Church St
- 401 Leonard St
- 314 Fern St
- 6429 Russia Rd
- 671 S Lake St
- 48221 Rice Rd
- 7720 Rice Rd
- 9113 Dean Rd
- 198 Oakdale Dr
- 5906 Russia Rd
- 2250 Claus Rd
- 0 Baumhart Rd
- 2745 Cooper Foster Park Rd
- 8030 Pyle South Amherst Rd
- 658 Nicole Dr
- 311 Oak St Unit 311
- 9950 Gifford Rd
- 9947 Gifford Rd
- 9918 Gifford Rd
- 9918 Gifford Rd
- 10023 Gifford Rd
- 49950 Telegraph Rd
- 49881 Telegraph Rd
- 49718 Telegraph Rd
- 49959 Telegraph Rd
- 10140 Gifford Rd
- 9814 Gifford Rd
- 49989 Telegraph Rd
- 49626 Telegraph Rd
- 9766 Gifford Rd
- 9766 Gifford Rd
- 10153 Gifford Rd
- 10226 Gifford Rd
- 50026 Telegraph Rd
- 9743 Gifford Rd
- 49665 Telegraph Rd