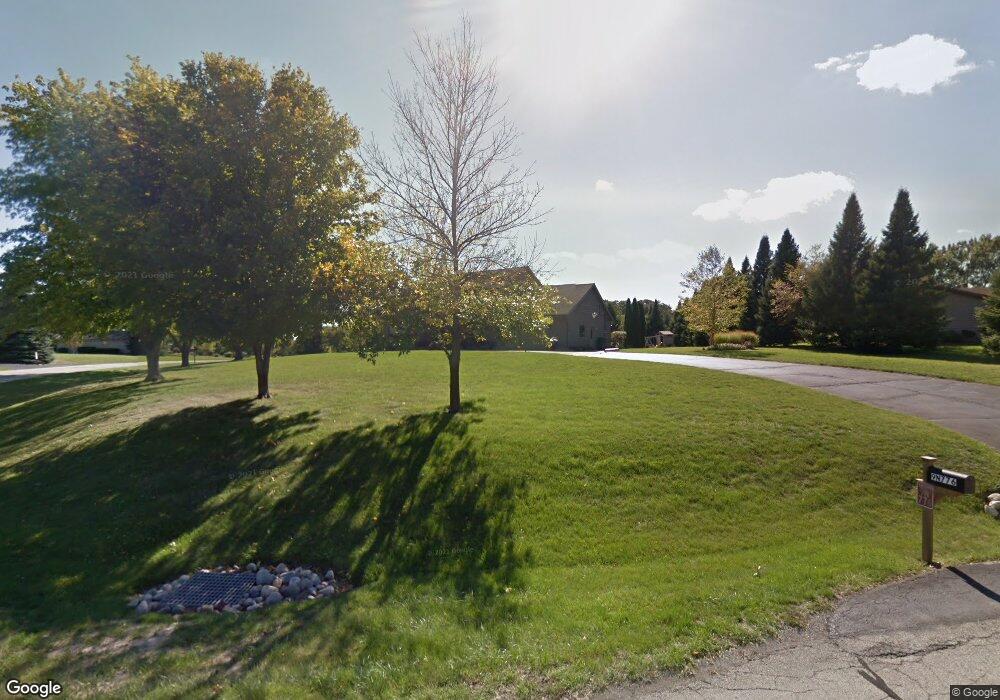
9N776 Apache Run Elgin, IL 60124
Providence NeighborhoodEstimated Value: $537,000 - $591,803
3
Beds
3
Baths
2,980
Sq Ft
$192/Sq Ft
Est. Value
About This Home
This home is located at 9N776 Apache Run, Elgin, IL 60124 and is currently estimated at $570,951, approximately $191 per square foot. 9N776 Apache Run is a home located in Kane County with nearby schools including Prairie View Grade School, Prairie Knolls Middle School, and Central Middle School.
Ownership History
Date
Name
Owned For
Owner Type
Purchase Details
Closed on
Jul 29, 2005
Sold by
Siedelberg Johanna D
Bought by
Killeen Daniel and Killeen Catherine
Current Estimated Value
Home Financials for this Owner
Home Financials are based on the most recent Mortgage that was taken out on this home.
Original Mortgage
$295,000
Outstanding Balance
$154,967
Interest Rate
5.66%
Mortgage Type
Fannie Mae Freddie Mac
Estimated Equity
$415,984
Purchase Details
Closed on
Feb 14, 2003
Sold by
Ali Younis M
Bought by
Siedelberg Mark A and Siedelberg Johnna D
Home Financials for this Owner
Home Financials are based on the most recent Mortgage that was taken out on this home.
Original Mortgage
$252,800
Interest Rate
6.06%
Create a Home Valuation Report for This Property
The Home Valuation Report is an in-depth analysis detailing your home's value as well as a comparison with similar homes in the area
Home Values in the Area
Average Home Value in this Area
Purchase History
| Date | Buyer | Sale Price | Title Company |
|---|---|---|---|
| Killeen Daniel | $380,000 | Chicago Title Insurance Comp | |
| Siedelberg Mark A | $316,000 | Fox Title Company |
Source: Public Records
Mortgage History
| Date | Status | Borrower | Loan Amount |
|---|---|---|---|
| Open | Killeen Daniel | $295,000 | |
| Previous Owner | Siedelberg Mark A | $252,800 |
Source: Public Records
Tax History
| Year | Tax Paid | Tax Assessment Tax Assessment Total Assessment is a certain percentage of the fair market value that is determined by local assessors to be the total taxable value of land and additions on the property. | Land | Improvement |
|---|---|---|---|---|
| 2024 | $11,303 | $152,548 | $27,638 | $124,910 |
| 2023 | $10,890 | $137,990 | $25,000 | $112,990 |
| 2022 | $10,228 | $124,238 | $23,138 | $101,100 |
| 2021 | $9,724 | $115,374 | $22,353 | $93,021 |
| 2020 | $9,697 | $113,300 | $21,951 | $91,349 |
| 2019 | $9,703 | $111,835 | $21,667 | $90,168 |
| 2018 | $9,665 | $112,008 | $20,664 | $91,344 |
| 2017 | $9,205 | $107,971 | $20,140 | $87,831 |
| 2016 | $9,751 | $105,409 | $19,662 | $85,747 |
| 2015 | -- | $97,089 | $19,662 | $77,427 |
| 2014 | -- | $97,807 | $19,662 | $78,145 |
| 2013 | -- | $101,516 | $19,998 | $81,518 |
Source: Public Records
Map
Nearby Homes
- 1159 Falcon Ridge Dr
- 1103 Championship Dr
- 1121 Iron Horse Ct
- 9N930 Koshare Cir
- 313 Monument Rd
- 9N827 Beckman Trail
- 3539 Crosswater Ct
- 4378 John Milton Rd
- 411 Hopkins Ave
- 3553 Doral Dr
- 424 Acushnet St
- 3545 S Riding Ridge
- 38W512 Bittersweet Ln
- 408 Fountain Ave
- 11N080 Juliet Dr Unit 2
- 3658 Thornhill Dr
- 3681 Congressional Pkwy
- 282 Snow Drop Ln
- 3641 Eldorado Rd
- 284 Snowdrop Ln
- 9N780 Apache Run
- 9N710 Hogan Hill
- 9N735 Hogan Hill
- 9N765 Hogan Hill
- 9N796 Apache Run
- 9N690 Hogan Hill
- 9N695 Hogan Hill
- 9N795 Hogan Hill
- 9N821 Apache Run
- 9N824 Apache Run
- 9N819 Hogan Hill
- 9N647 Hogan Hill
- 9N680 Pueblo Peak
- 6 Lori Ln
- 9N660 Pueblo Peak
- 39W398 Hogan Hill
- 9N692 Pueblo Peak
- 9N650 Hogan Hill
- 39W349 Hogan Hill
- 39W349 Hogan Hill
Your Personal Tour Guide
Ask me questions while you tour the home.