
Seller's Agent in 2020
Gillian Arnwine
The Wells Group of Durango, LLC
(970) 749-3704
28 Total Sales
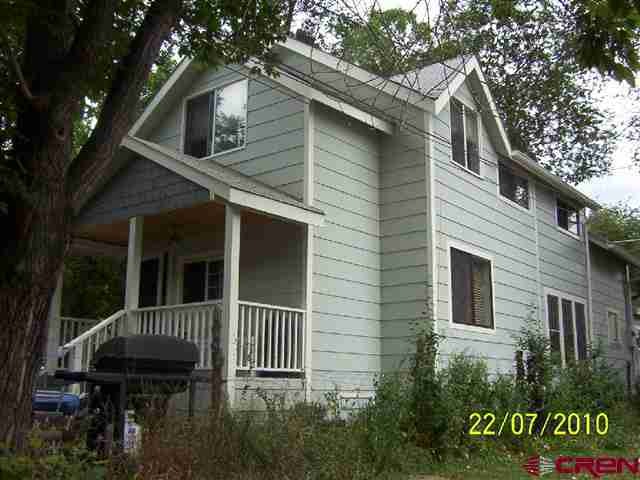


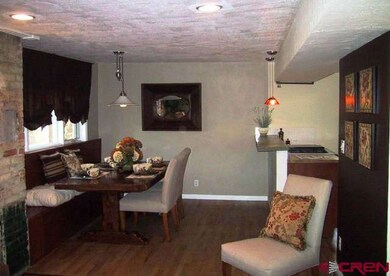
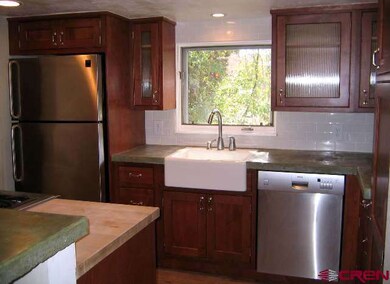
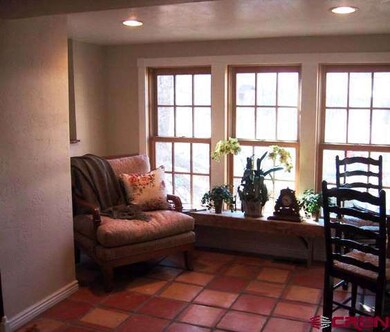

What a treat to pedal your cruiser bike home after a wonderful dinner downtown with your significant other. Or you've just come from walking on the nearby River Trail and your returning to get ready for a BBQ with friends before the concert tonight. The yard is lush and looks great, the gardens in bloom and you're enjoying just sitting on the front porch watching the neighborhood kids play. The home is warm and inviting with cool custom touches throughout. Your good-taste touch will make this charming home one for friends to envy. The upscale kitchen is alive with activity and your favorite dish smells great....maybe take a nap in the comfy chair in the den or slip away to the Master Suite with its private bath. Living right in Historic Downtown Durango has its perks....great biking, a quick walk to schoos or a stroll down for Sushi at Happy Hour. Park the car and enjoy your bike. Very well maintained, this home just needs your personal touch and love and its a keeper. ** POTENTIAL SHORT SALE** as of 8/12/11.
Last Agent to Sell the Property
Keller Williams Realty Southwest Associates, LLC Listed on: 10/27/2011
| Date | Type | Sale Price | Title Company |
|---|---|---|---|
| Personal Reps Deed | $950,000 | None Listed On Document | |
| Warranty Deed | $610,000 | Land Title |
| Date | Status | Loan Amount | Loan Type |
|---|---|---|---|
| Open | $700,001 | New Conventional |
| Date | Event | Price | Change | Sq Ft Price |
|---|---|---|---|---|
| 11/16/2020 11/16/20 | Sold | $1,455,000 | -2.9% | $296 / Sq Ft |
| 10/03/2020 10/03/20 | Pending | -- | -- | -- |
| 06/11/2020 06/11/20 | Price Changed | $1,499,000 | +158.4% | $305 / Sq Ft |
| 06/01/2020 06/01/20 | Sold | $580,000 | -62.6% | $361 / Sq Ft |
| 05/21/2020 05/21/20 | For Sale | $1,550,000 | 0.0% | $315 / Sq Ft |
| 05/20/2020 05/20/20 | Pending | -- | -- | -- |
| 05/05/2020 05/05/20 | Pending | -- | -- | -- |
| 04/27/2020 04/27/20 | For Sale | $1,550,000 | +6.5% | $315 / Sq Ft |
| 04/07/2020 04/07/20 | Off Market | $1,455,000 | -- | -- |
| 03/17/2020 03/17/20 | For Sale | $1,550,000 | +148.0% | $315 / Sq Ft |
| 03/02/2020 03/02/20 | For Sale | $625,000 | +54.3% | $389 / Sq Ft |
| 02/18/2020 02/18/20 | Sold | $405,000 | +4.1% | $345 / Sq Ft |
| 01/24/2020 01/24/20 | Pending | -- | -- | -- |
| 01/22/2020 01/22/20 | For Sale | $389,000 | -52.8% | $331 / Sq Ft |
| 01/10/2020 01/10/20 | Sold | $824,000 | -2.9% | $298 / Sq Ft |
| 10/09/2019 10/09/19 | Pending | -- | -- | -- |
| 10/04/2019 10/04/19 | Price Changed | $849,000 | +30.8% | $307 / Sq Ft |
| 10/03/2019 10/03/19 | Sold | $649,300 | -27.8% | $418 / Sq Ft |
| 08/06/2019 08/06/19 | Price Changed | $899,000 | -39.9% | $325 / Sq Ft |
| 07/27/2019 07/27/19 | Pending | -- | -- | -- |
| 07/25/2019 07/25/19 | Sold | $1,495,000 | +121.5% | $304 / Sq Ft |
| 07/25/2019 07/25/19 | For Sale | $674,900 | -28.6% | $435 / Sq Ft |
| 06/17/2019 06/17/19 | For Sale | $945,000 | -39.0% | $341 / Sq Ft |
| 06/07/2019 06/07/19 | Pending | -- | -- | -- |
| 05/28/2019 05/28/19 | For Sale | $1,550,000 | +144.1% | $315 / Sq Ft |
| 03/15/2019 03/15/19 | Sold | $635,000 | -31.4% | $409 / Sq Ft |
| 02/13/2019 02/13/19 | Pending | -- | -- | -- |
| 12/21/2018 12/21/18 | Sold | $925,000 | +42.5% | $334 / Sq Ft |
| 12/07/2018 12/07/18 | Pending | -- | -- | -- |
| 11/06/2018 11/06/18 | For Sale | $649,000 | +47.5% | $418 / Sq Ft |
| 09/19/2018 09/19/18 | Sold | $440,000 | -2.0% | $447 / Sq Ft |
| 08/20/2018 08/20/18 | Pending | -- | -- | -- |
| 07/29/2018 07/29/18 | Price Changed | $449,000 | -51.5% | $456 / Sq Ft |
| 07/27/2018 07/27/18 | For Sale | $925,000 | +102.0% | $334 / Sq Ft |
| 07/10/2018 07/10/18 | Price Changed | $458,000 | -0.2% | $465 / Sq Ft |
| 06/27/2018 06/27/18 | For Sale | $459,000 | +2.0% | $466 / Sq Ft |
| 04/24/2018 04/24/18 | Sold | $450,000 | -7.6% | $434 / Sq Ft |
| 04/20/2018 04/20/18 | Sold | $487,000 | +10.7% | $278 / Sq Ft |
| 03/23/2018 03/23/18 | Pending | -- | -- | -- |
| 03/21/2018 03/21/18 | For Sale | $440,000 | -11.1% | $425 / Sq Ft |
| 02/18/2018 02/18/18 | Pending | -- | -- | -- |
| 02/12/2018 02/12/18 | For Sale | $495,000 | -60.7% | $283 / Sq Ft |
| 01/16/2018 01/16/18 | Sold | $1,260,000 | -2.3% | $356 / Sq Ft |
| 01/04/2018 01/04/18 | Pending | -- | -- | -- |
| 01/04/2018 01/04/18 | For Sale | $1,290,000 | +35.8% | $365 / Sq Ft |
| 12/21/2017 12/21/17 | Sold | $950,000 | +11.1% | $272 / Sq Ft |
| 12/21/2017 12/21/17 | Sold | $855,000 | -10.9% | $270 / Sq Ft |
| 12/05/2017 12/05/17 | Sold | $960,000 | -25.6% | $267 / Sq Ft |
| 11/22/2017 11/22/17 | Pending | -- | -- | -- |
| 11/19/2017 11/19/17 | Pending | -- | -- | -- |
| 11/10/2017 11/10/17 | Price Changed | $1,290,000 | -7.2% | $365 / Sq Ft |
| 10/31/2017 10/31/17 | Pending | -- | -- | -- |
| 10/02/2017 10/02/17 | Price Changed | $1,390,000 | +275.7% | $393 / Sq Ft |
| 09/19/2017 09/19/17 | Sold | $370,000 | -58.8% | $374 / Sq Ft |
| 09/07/2017 09/07/17 | Price Changed | $897,000 | -35.9% | $283 / Sq Ft |
| 09/05/2017 09/05/17 | Price Changed | $1,399,000 | -0.1% | $396 / Sq Ft |
| 09/01/2017 09/01/17 | For Sale | $1,399,900 | +41.4% | $396 / Sq Ft |
| 08/14/2017 08/14/17 | For Sale | $989,900 | +167.5% | $276 / Sq Ft |
| 08/02/2017 08/02/17 | Off Market | $370,000 | -- | -- |
| 07/17/2017 07/17/17 | Price Changed | $927,000 | +202.0% | $292 / Sq Ft |
| 06/26/2017 06/26/17 | Sold | $307,000 | -69.1% | $374 / Sq Ft |
| 06/07/2017 06/07/17 | For Sale | $995,000 | +156.4% | $285 / Sq Ft |
| 05/30/2017 05/30/17 | Price Changed | $388,000 | -61.2% | $393 / Sq Ft |
| 05/21/2017 05/21/17 | Price Changed | $999,750 | +207.6% | $315 / Sq Ft |
| 05/16/2017 05/16/17 | Pending | -- | -- | -- |
| 04/26/2017 04/26/17 | For Sale | $325,000 | -75.0% | $396 / Sq Ft |
| 04/20/2017 04/20/17 | Sold | $1,300,000 | +22.7% | $509 / Sq Ft |
| 04/07/2017 04/07/17 | For Sale | $1,059,500 | +166.2% | $334 / Sq Ft |
| 02/17/2017 02/17/17 | Pending | -- | -- | -- |
| 02/09/2017 02/09/17 | For Sale | $398,000 | -5.2% | $403 / Sq Ft |
| 10/12/2016 10/12/16 | Sold | $420,000 | -10.6% | $208 / Sq Ft |
| 09/20/2016 09/20/16 | Pending | -- | -- | -- |
| 09/20/2016 09/20/16 | For Sale | $470,000 | -14.5% | $233 / Sq Ft |
| 09/01/2016 09/01/16 | Sold | $550,000 | +8.9% | $240 / Sq Ft |
| 09/01/2016 09/01/16 | Sold | $505,000 | -17.2% | $273 / Sq Ft |
| 08/15/2016 08/15/16 | Sold | $610,000 | -59.3% | $385 / Sq Ft |
| 07/23/2016 07/23/16 | Pending | -- | -- | -- |
| 07/22/2016 07/22/16 | Pending | -- | -- | -- |
| 07/05/2016 07/05/16 | For Sale | $1,499,000 | +132.4% | $587 / Sq Ft |
| 06/20/2016 06/20/16 | Pending | -- | -- | -- |
| 06/10/2016 06/10/16 | For Sale | $645,000 | +95.5% | $407 / Sq Ft |
| 06/01/2016 06/01/16 | Sold | $330,000 | -12.0% | $395 / Sq Ft |
| 06/01/2016 06/01/16 | Sold | $375,000 | -35.9% | $337 / Sq Ft |
| 05/16/2016 05/16/16 | For Sale | $585,000 | +56.0% | $317 / Sq Ft |
| 04/05/2016 04/05/16 | Pending | -- | -- | -- |
| 04/04/2016 04/04/16 | For Sale | $375,000 | -43.6% | $337 / Sq Ft |
| 03/23/2016 03/23/16 | Pending | -- | -- | -- |
| 02/21/2016 02/21/16 | For Sale | $665,000 | +95.6% | $290 / Sq Ft |
| 01/26/2016 01/26/16 | For Sale | $340,000 | +7.9% | $407 / Sq Ft |
| 12/02/2015 12/02/15 | Sold | $315,000 | +15.6% | $272 / Sq Ft |
| 10/28/2015 10/28/15 | Sold | $272,500 | -21.0% | $168 / Sq Ft |
| 10/11/2015 10/11/15 | Pending | -- | -- | -- |
| 10/01/2015 10/01/15 | Pending | -- | -- | -- |
| 09/15/2015 09/15/15 | For Sale | $345,000 | +6.2% | $298 / Sq Ft |
| 05/04/2015 05/04/15 | For Sale | $325,000 | -14.5% | $200 / Sq Ft |
| 03/25/2015 03/25/15 | Sold | $380,000 | -19.1% | $250 / Sq Ft |
| 02/12/2015 02/12/15 | Sold | $470,000 | +2.2% | $272 / Sq Ft |
| 02/05/2015 02/05/15 | Pending | -- | -- | -- |
| 01/26/2015 01/26/15 | For Sale | $459,900 | -11.2% | $302 / Sq Ft |
| 01/10/2015 01/10/15 | Pending | -- | -- | -- |
| 08/29/2014 08/29/14 | For Sale | $518,000 | -24.4% | $300 / Sq Ft |
| 06/19/2014 06/19/14 | Sold | $685,000 | +37.0% | $209 / Sq Ft |
| 06/06/2014 06/06/14 | Sold | $500,000 | +35.5% | $268 / Sq Ft |
| 05/29/2014 05/29/14 | Sold | $369,000 | -48.8% | $452 / Sq Ft |
| 05/05/2014 05/05/14 | For Sale | $720,000 | +44.9% | $220 / Sq Ft |
| 05/01/2014 05/01/14 | Pending | -- | -- | -- |
| 04/21/2014 04/21/14 | Pending | -- | -- | -- |
| 04/16/2014 04/16/14 | Sold | $497,000 | +24.3% | $205 / Sq Ft |
| 04/15/2014 04/15/14 | For Sale | $399,900 | -25.8% | $490 / Sq Ft |
| 04/14/2014 04/14/14 | Pending | -- | -- | -- |
| 03/03/2014 03/03/14 | For Sale | $539,000 | +3.7% | $289 / Sq Ft |
| 02/24/2014 02/24/14 | Pending | -- | -- | -- |
| 01/24/2014 01/24/14 | For Sale | $519,900 | -1.9% | $215 / Sq Ft |
| 12/04/2013 12/04/13 | Sold | $530,000 | +69.9% | $245 / Sq Ft |
| 10/30/2013 10/30/13 | Sold | $312,000 | -37.6% | $223 / Sq Ft |
| 10/14/2013 10/14/13 | Pending | -- | -- | -- |
| 10/09/2013 10/09/13 | For Sale | $499,900 | -5.7% | $231 / Sq Ft |
| 09/26/2013 09/26/13 | Sold | $530,000 | +20.5% | $203 / Sq Ft |
| 08/26/2013 08/26/13 | Pending | -- | -- | -- |
| 08/19/2013 08/19/13 | Pending | -- | -- | -- |
| 05/11/2013 05/11/13 | Sold | $440,000 | -21.3% | $218 / Sq Ft |
| 05/10/2013 05/10/13 | For Sale | $559,000 | +80.3% | $214 / Sq Ft |
| 04/09/2013 04/09/13 | Sold | $310,000 | -32.5% | $362 / Sq Ft |
| 03/11/2013 03/11/13 | For Sale | $459,000 | +39.9% | $228 / Sq Ft |
| 03/08/2013 03/08/13 | Pending | -- | -- | -- |
| 02/06/2013 02/06/13 | Pending | -- | -- | -- |
| 01/22/2013 01/22/13 | Sold | $328,000 | -0.3% | $319 / Sq Ft |
| 12/28/2012 12/28/12 | For Sale | $329,000 | -3.2% | $384 / Sq Ft |
| 12/03/2012 12/03/12 | For Sale | $340,000 | -1.4% | $243 / Sq Ft |
| 11/13/2012 11/13/12 | Pending | -- | -- | -- |
| 10/24/2012 10/24/12 | Sold | $345,000 | -49.6% | $215 / Sq Ft |
| 10/18/2012 10/18/12 | Sold | $685,000 | +179.6% | $183 / Sq Ft |
| 10/16/2012 10/16/12 | Pending | -- | -- | -- |
| 09/07/2012 09/07/12 | Sold | $245,000 | -25.7% | $151 / Sq Ft |
| 09/05/2012 09/05/12 | For Sale | $329,875 | -12.0% | $321 / Sq Ft |
| 08/31/2012 08/31/12 | Pending | -- | -- | -- |
| 08/08/2012 08/08/12 | For Sale | $375,000 | -46.0% | $233 / Sq Ft |
| 07/16/2012 07/16/12 | Pending | -- | -- | -- |
| 07/10/2012 07/10/12 | For Sale | $695,000 | +100.3% | $186 / Sq Ft |
| 06/05/2012 06/05/12 | Sold | $347,000 | -26.9% | $203 / Sq Ft |
| 05/31/2012 05/31/12 | Sold | $475,000 | 0.0% | $193 / Sq Ft |
| 05/10/2012 05/10/12 | Pending | -- | -- | -- |
| 04/23/2012 04/23/12 | For Sale | $475,000 | +76.6% | $193 / Sq Ft |
| 04/17/2012 04/17/12 | Pending | -- | -- | -- |
| 03/16/2012 03/16/12 | For Sale | $269,000 | +12.1% | $166 / Sq Ft |
| 02/29/2012 02/29/12 | Sold | $240,000 | -33.3% | $242 / Sq Ft |
| 02/24/2012 02/24/12 | For Sale | $359,900 | +20.0% | $211 / Sq Ft |
| 02/10/2012 02/10/12 | Sold | $300,000 | -13.0% | $187 / Sq Ft |
| 01/09/2012 01/09/12 | Pending | -- | -- | -- |
| 12/05/2011 12/05/11 | Pending | -- | -- | -- |
| 10/27/2011 10/27/11 | For Sale | $344,900 | +25.4% | $215 / Sq Ft |
| 08/17/2011 08/17/11 | For Sale | $275,000 | -- | $278 / Sq Ft |
| Year | Tax Paid | Tax Assessment Tax Assessment Total Assessment is a certain percentage of the fair market value that is determined by local assessors to be the total taxable value of land and additions on the property. | Land | Improvement |
|---|---|---|---|---|
| 2025 | $2,512 | $63,660 | $23,520 | $40,140 |
| 2024 | $2,137 | $53,160 | $17,780 | $35,380 |
| 2023 | $2,137 | $56,380 | $18,860 | $37,520 |
| 2022 | $1,842 | $58,960 | $19,720 | $39,240 |
| 2021 | $1,849 | $46,580 | $16,980 | $29,600 |
| 2020 | $1,715 | $44,600 | $16,800 | $27,800 |
| 2019 | $1,640 | $44,600 | $16,800 | $27,800 |
| 2018 | $1,524 | $41,950 | $15,930 | $26,020 |
| 2017 | $1,490 | $41,950 | $15,930 | $26,020 |
| 2016 | $1,358 | $41,660 | $15,220 | $26,440 |
| 2015 | $1,272 | $41,660 | $15,220 | $26,440 |
| 2014 | -- | $37,250 | $14,630 | $22,620 |
| 2013 | -- | $37,250 | $14,630 | $22,620 |
Seller's Agent in 2020
Gillian Arnwine
The Wells Group of Durango, LLC
(970) 749-3704
28 Total Sales
Seller's Agent in 2020
Brittany McCoy
Legacy Properties West Sotheby's Int. Realty
(970) 946-3238
4 in this area
99 Total Sales
Seller's Agent in 2020
Gabi Bergstrom
RE/MAX
(970) 946-7522
13 in this area
164 Total Sales
Buyer's Agent in 2020
Anne Zalbowitz
Keller Williams Realty Southwest Associates, LLC
(970) 769-4892
2 in this area
78 Total Sales
Buyer's Agent in 2020
Max Hutcheson
The Wells Group of Durango, LLC
(970) 375-7014
1 in this area
334 Total Sales
Buyer's Agent in 2020
Linda Buzzalini
Linda Buzzalini, Independent Broker
(970) 749-4249
20 Total Sales
Source: Colorado Real Estate Network (CREN)
MLS Number: 663311
APN: R002683
Disclaimer: Certain information contained herein is derived from information provided by parties other than Homes.com. All information provided is deemed reliable, but is not guaranteed to be accurate and should be independently verified.
![]() IDX information is provided exclusively for personal, non-commercial use, and may not be used for any purpose other than to identify prospective properties consumers may be interested in purchasing. Information is deemed reliable but not guaranteed.
IDX information is provided exclusively for personal, non-commercial use, and may not be used for any purpose other than to identify prospective properties consumers may be interested in purchasing. Information is deemed reliable but not guaranteed.