
Seller's Agent in 2020
Gillian Arnwine
The Wells Group of Durango, LLC
(970) 749-3704
28 Total Sales
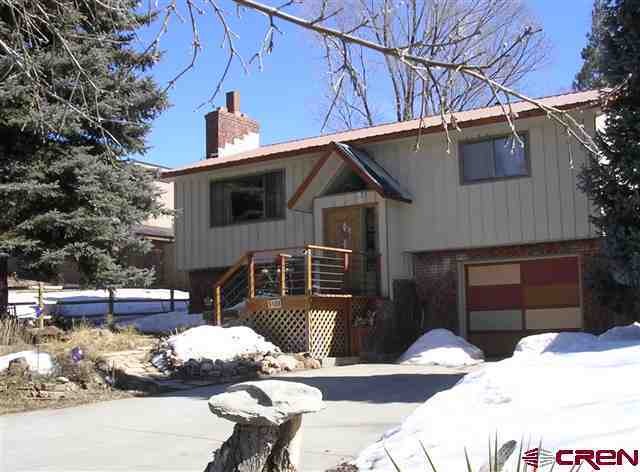
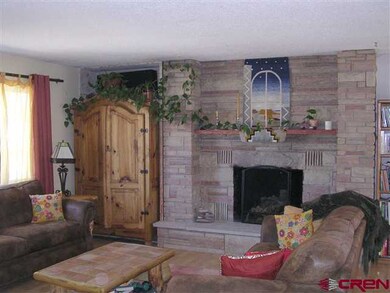
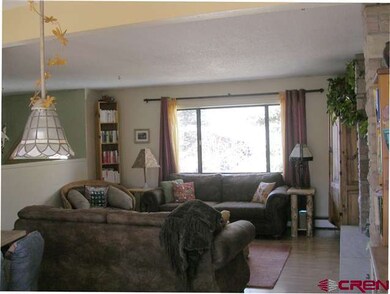
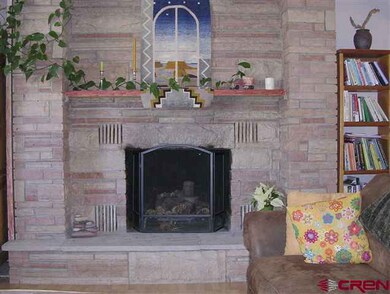
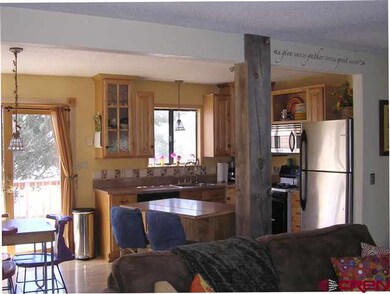
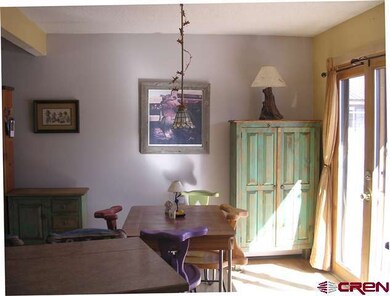
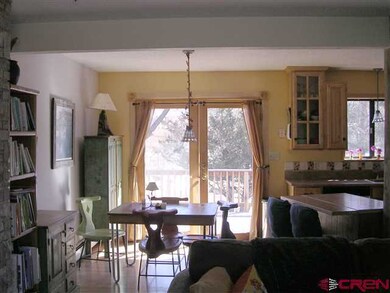
In town home conveniently located near schools and so close to the river trail you can enjoy walking along the river to the recreation center, fairgrounds, library and high school. The front yard is nicely xeriscaped and the backyard has a garden area, fruit trees, raspberry bushes and much more. The cozy living room offers a beautiful fireplace and hearth. The kitchen is small but efficient and open to the main living area. The main floor is open and bright with French doors that lead to an inviting deck. Downstairs you’ll find the family room with another fireplace. The third bedroom, second bath and laundry room are also downstairs.
Last Agent to Sell the Property
Carol Burnham
Coldwell Banker Distinctive Properties Listed on: 02/24/2012
| Date | Type | Sale Price | Title Company |
|---|---|---|---|
| Personal Reps Deed | $950,000 | None Listed On Document | |
| Warranty Deed | $610,000 | Land Title |
| Date | Status | Loan Amount | Loan Type |
|---|---|---|---|
| Open | $700,001 | New Conventional |
| Date | Event | Price | Change | Sq Ft Price |
|---|---|---|---|---|
| 11/16/2020 11/16/20 | Sold | $1,455,000 | -2.9% | $296 / Sq Ft |
| 10/03/2020 10/03/20 | Pending | -- | -- | -- |
| 06/11/2020 06/11/20 | Price Changed | $1,499,000 | +158.4% | $305 / Sq Ft |
| 06/01/2020 06/01/20 | Sold | $580,000 | -62.6% | $361 / Sq Ft |
| 05/21/2020 05/21/20 | For Sale | $1,550,000 | 0.0% | $315 / Sq Ft |
| 05/20/2020 05/20/20 | Pending | -- | -- | -- |
| 05/05/2020 05/05/20 | Pending | -- | -- | -- |
| 04/27/2020 04/27/20 | For Sale | $1,550,000 | +6.5% | $315 / Sq Ft |
| 04/07/2020 04/07/20 | Off Market | $1,455,000 | -- | -- |
| 03/17/2020 03/17/20 | For Sale | $1,550,000 | +148.0% | $315 / Sq Ft |
| 03/02/2020 03/02/20 | For Sale | $625,000 | +54.3% | $389 / Sq Ft |
| 02/18/2020 02/18/20 | Sold | $405,000 | +4.1% | $345 / Sq Ft |
| 01/24/2020 01/24/20 | Pending | -- | -- | -- |
| 01/22/2020 01/22/20 | For Sale | $389,000 | -52.8% | $331 / Sq Ft |
| 01/10/2020 01/10/20 | Sold | $824,000 | -2.9% | $298 / Sq Ft |
| 10/09/2019 10/09/19 | Pending | -- | -- | -- |
| 10/04/2019 10/04/19 | Price Changed | $849,000 | +30.8% | $307 / Sq Ft |
| 10/03/2019 10/03/19 | Sold | $649,300 | -27.8% | $418 / Sq Ft |
| 08/06/2019 08/06/19 | Price Changed | $899,000 | -39.9% | $325 / Sq Ft |
| 07/27/2019 07/27/19 | Pending | -- | -- | -- |
| 07/25/2019 07/25/19 | Sold | $1,495,000 | +121.5% | $304 / Sq Ft |
| 07/25/2019 07/25/19 | For Sale | $674,900 | -28.6% | $435 / Sq Ft |
| 06/17/2019 06/17/19 | For Sale | $945,000 | -39.0% | $341 / Sq Ft |
| 06/07/2019 06/07/19 | Pending | -- | -- | -- |
| 05/28/2019 05/28/19 | For Sale | $1,550,000 | +144.1% | $315 / Sq Ft |
| 03/15/2019 03/15/19 | Sold | $635,000 | -31.4% | $409 / Sq Ft |
| 02/13/2019 02/13/19 | Pending | -- | -- | -- |
| 12/21/2018 12/21/18 | Sold | $925,000 | +42.5% | $334 / Sq Ft |
| 12/07/2018 12/07/18 | Pending | -- | -- | -- |
| 11/06/2018 11/06/18 | For Sale | $649,000 | +47.5% | $418 / Sq Ft |
| 09/19/2018 09/19/18 | Sold | $440,000 | -2.0% | $447 / Sq Ft |
| 08/20/2018 08/20/18 | Pending | -- | -- | -- |
| 07/29/2018 07/29/18 | Price Changed | $449,000 | -51.5% | $456 / Sq Ft |
| 07/27/2018 07/27/18 | For Sale | $925,000 | +102.0% | $334 / Sq Ft |
| 07/10/2018 07/10/18 | Price Changed | $458,000 | -0.2% | $465 / Sq Ft |
| 06/27/2018 06/27/18 | For Sale | $459,000 | +2.0% | $466 / Sq Ft |
| 04/24/2018 04/24/18 | Sold | $450,000 | -7.6% | $434 / Sq Ft |
| 04/20/2018 04/20/18 | Sold | $487,000 | +10.7% | $278 / Sq Ft |
| 03/23/2018 03/23/18 | Pending | -- | -- | -- |
| 03/21/2018 03/21/18 | For Sale | $440,000 | -11.1% | $425 / Sq Ft |
| 02/18/2018 02/18/18 | Pending | -- | -- | -- |
| 02/12/2018 02/12/18 | For Sale | $495,000 | -60.7% | $283 / Sq Ft |
| 01/16/2018 01/16/18 | Sold | $1,260,000 | -2.3% | $356 / Sq Ft |
| 01/04/2018 01/04/18 | Pending | -- | -- | -- |
| 01/04/2018 01/04/18 | For Sale | $1,290,000 | +35.8% | $365 / Sq Ft |
| 12/21/2017 12/21/17 | Sold | $950,000 | +11.1% | $272 / Sq Ft |
| 12/21/2017 12/21/17 | Sold | $855,000 | -10.9% | $270 / Sq Ft |
| 12/05/2017 12/05/17 | Sold | $960,000 | -25.6% | $267 / Sq Ft |
| 11/22/2017 11/22/17 | Pending | -- | -- | -- |
| 11/19/2017 11/19/17 | Pending | -- | -- | -- |
| 11/10/2017 11/10/17 | Price Changed | $1,290,000 | -7.2% | $365 / Sq Ft |
| 10/31/2017 10/31/17 | Pending | -- | -- | -- |
| 10/02/2017 10/02/17 | Price Changed | $1,390,000 | +275.7% | $393 / Sq Ft |
| 09/19/2017 09/19/17 | Sold | $370,000 | -58.8% | $374 / Sq Ft |
| 09/07/2017 09/07/17 | Price Changed | $897,000 | -35.9% | $283 / Sq Ft |
| 09/05/2017 09/05/17 | Price Changed | $1,399,000 | -0.1% | $396 / Sq Ft |
| 09/01/2017 09/01/17 | For Sale | $1,399,900 | +41.4% | $396 / Sq Ft |
| 08/14/2017 08/14/17 | For Sale | $989,900 | +167.5% | $276 / Sq Ft |
| 08/02/2017 08/02/17 | Off Market | $370,000 | -- | -- |
| 07/17/2017 07/17/17 | Price Changed | $927,000 | +202.0% | $292 / Sq Ft |
| 06/26/2017 06/26/17 | Sold | $307,000 | -69.1% | $374 / Sq Ft |
| 06/07/2017 06/07/17 | For Sale | $995,000 | +156.4% | $285 / Sq Ft |
| 05/30/2017 05/30/17 | Price Changed | $388,000 | -61.2% | $393 / Sq Ft |
| 05/21/2017 05/21/17 | Price Changed | $999,750 | +207.6% | $315 / Sq Ft |
| 05/16/2017 05/16/17 | Pending | -- | -- | -- |
| 04/26/2017 04/26/17 | For Sale | $325,000 | -75.0% | $396 / Sq Ft |
| 04/20/2017 04/20/17 | Sold | $1,300,000 | +22.7% | $509 / Sq Ft |
| 04/07/2017 04/07/17 | For Sale | $1,059,500 | +166.2% | $334 / Sq Ft |
| 02/17/2017 02/17/17 | Pending | -- | -- | -- |
| 02/09/2017 02/09/17 | For Sale | $398,000 | -5.2% | $403 / Sq Ft |
| 10/12/2016 10/12/16 | Sold | $420,000 | -10.6% | $208 / Sq Ft |
| 09/20/2016 09/20/16 | Pending | -- | -- | -- |
| 09/20/2016 09/20/16 | For Sale | $470,000 | -14.5% | $233 / Sq Ft |
| 09/01/2016 09/01/16 | Sold | $550,000 | +8.9% | $240 / Sq Ft |
| 09/01/2016 09/01/16 | Sold | $505,000 | -17.2% | $273 / Sq Ft |
| 08/15/2016 08/15/16 | Sold | $610,000 | -59.3% | $385 / Sq Ft |
| 07/23/2016 07/23/16 | Pending | -- | -- | -- |
| 07/22/2016 07/22/16 | Pending | -- | -- | -- |
| 07/05/2016 07/05/16 | For Sale | $1,499,000 | +132.4% | $587 / Sq Ft |
| 06/20/2016 06/20/16 | Pending | -- | -- | -- |
| 06/10/2016 06/10/16 | For Sale | $645,000 | +95.5% | $407 / Sq Ft |
| 06/01/2016 06/01/16 | Sold | $330,000 | -12.0% | $395 / Sq Ft |
| 06/01/2016 06/01/16 | Sold | $375,000 | -35.9% | $337 / Sq Ft |
| 05/16/2016 05/16/16 | For Sale | $585,000 | +56.0% | $317 / Sq Ft |
| 04/05/2016 04/05/16 | Pending | -- | -- | -- |
| 04/04/2016 04/04/16 | For Sale | $375,000 | -43.6% | $337 / Sq Ft |
| 03/23/2016 03/23/16 | Pending | -- | -- | -- |
| 02/21/2016 02/21/16 | For Sale | $665,000 | +95.6% | $290 / Sq Ft |
| 01/26/2016 01/26/16 | For Sale | $340,000 | +7.9% | $407 / Sq Ft |
| 12/02/2015 12/02/15 | Sold | $315,000 | +15.6% | $272 / Sq Ft |
| 10/28/2015 10/28/15 | Sold | $272,500 | -21.0% | $168 / Sq Ft |
| 10/11/2015 10/11/15 | Pending | -- | -- | -- |
| 10/01/2015 10/01/15 | Pending | -- | -- | -- |
| 09/15/2015 09/15/15 | For Sale | $345,000 | +6.2% | $298 / Sq Ft |
| 05/04/2015 05/04/15 | For Sale | $325,000 | -14.5% | $200 / Sq Ft |
| 03/25/2015 03/25/15 | Sold | $380,000 | -19.1% | $250 / Sq Ft |
| 02/12/2015 02/12/15 | Sold | $470,000 | +2.2% | $272 / Sq Ft |
| 02/05/2015 02/05/15 | Pending | -- | -- | -- |
| 01/26/2015 01/26/15 | For Sale | $459,900 | -11.2% | $302 / Sq Ft |
| 01/10/2015 01/10/15 | Pending | -- | -- | -- |
| 08/29/2014 08/29/14 | For Sale | $518,000 | -24.4% | $300 / Sq Ft |
| 06/19/2014 06/19/14 | Sold | $685,000 | +37.0% | $209 / Sq Ft |
| 06/06/2014 06/06/14 | Sold | $500,000 | +35.5% | $268 / Sq Ft |
| 05/29/2014 05/29/14 | Sold | $369,000 | -48.8% | $452 / Sq Ft |
| 05/05/2014 05/05/14 | For Sale | $720,000 | +44.9% | $220 / Sq Ft |
| 05/01/2014 05/01/14 | Pending | -- | -- | -- |
| 04/21/2014 04/21/14 | Pending | -- | -- | -- |
| 04/16/2014 04/16/14 | Sold | $497,000 | +24.3% | $205 / Sq Ft |
| 04/15/2014 04/15/14 | For Sale | $399,900 | -25.8% | $490 / Sq Ft |
| 04/14/2014 04/14/14 | Pending | -- | -- | -- |
| 03/03/2014 03/03/14 | For Sale | $539,000 | +3.7% | $289 / Sq Ft |
| 02/24/2014 02/24/14 | Pending | -- | -- | -- |
| 01/24/2014 01/24/14 | For Sale | $519,900 | -1.9% | $215 / Sq Ft |
| 12/04/2013 12/04/13 | Sold | $530,000 | +69.9% | $245 / Sq Ft |
| 10/30/2013 10/30/13 | Sold | $312,000 | -37.6% | $223 / Sq Ft |
| 10/14/2013 10/14/13 | Pending | -- | -- | -- |
| 10/09/2013 10/09/13 | For Sale | $499,900 | -5.7% | $231 / Sq Ft |
| 09/26/2013 09/26/13 | Sold | $530,000 | +20.5% | $203 / Sq Ft |
| 08/26/2013 08/26/13 | Pending | -- | -- | -- |
| 08/19/2013 08/19/13 | Pending | -- | -- | -- |
| 05/11/2013 05/11/13 | Sold | $440,000 | -21.3% | $218 / Sq Ft |
| 05/10/2013 05/10/13 | For Sale | $559,000 | +80.3% | $214 / Sq Ft |
| 04/09/2013 04/09/13 | Sold | $310,000 | -32.5% | $362 / Sq Ft |
| 03/11/2013 03/11/13 | For Sale | $459,000 | +39.9% | $228 / Sq Ft |
| 03/08/2013 03/08/13 | Pending | -- | -- | -- |
| 02/06/2013 02/06/13 | Pending | -- | -- | -- |
| 01/22/2013 01/22/13 | Sold | $328,000 | -0.3% | $319 / Sq Ft |
| 12/28/2012 12/28/12 | For Sale | $329,000 | -3.2% | $384 / Sq Ft |
| 12/03/2012 12/03/12 | For Sale | $340,000 | -1.4% | $243 / Sq Ft |
| 11/13/2012 11/13/12 | Pending | -- | -- | -- |
| 10/24/2012 10/24/12 | Sold | $345,000 | -49.6% | $215 / Sq Ft |
| 10/18/2012 10/18/12 | Sold | $685,000 | +179.6% | $183 / Sq Ft |
| 10/16/2012 10/16/12 | Pending | -- | -- | -- |
| 09/07/2012 09/07/12 | Sold | $245,000 | -25.7% | $151 / Sq Ft |
| 09/05/2012 09/05/12 | For Sale | $329,875 | -12.0% | $321 / Sq Ft |
| 08/31/2012 08/31/12 | Pending | -- | -- | -- |
| 08/08/2012 08/08/12 | For Sale | $375,000 | -46.0% | $233 / Sq Ft |
| 07/16/2012 07/16/12 | Pending | -- | -- | -- |
| 07/10/2012 07/10/12 | For Sale | $695,000 | +100.3% | $186 / Sq Ft |
| 06/05/2012 06/05/12 | Sold | $347,000 | -26.9% | $203 / Sq Ft |
| 05/31/2012 05/31/12 | Sold | $475,000 | 0.0% | $193 / Sq Ft |
| 05/10/2012 05/10/12 | Pending | -- | -- | -- |
| 04/23/2012 04/23/12 | For Sale | $475,000 | +76.6% | $193 / Sq Ft |
| 04/17/2012 04/17/12 | Pending | -- | -- | -- |
| 03/16/2012 03/16/12 | For Sale | $269,000 | +12.1% | $166 / Sq Ft |
| 02/29/2012 02/29/12 | Sold | $240,000 | -33.3% | $242 / Sq Ft |
| 02/24/2012 02/24/12 | For Sale | $359,900 | +20.0% | $211 / Sq Ft |
| 02/10/2012 02/10/12 | Sold | $300,000 | -13.0% | $187 / Sq Ft |
| 01/09/2012 01/09/12 | Pending | -- | -- | -- |
| 12/05/2011 12/05/11 | Pending | -- | -- | -- |
| 10/27/2011 10/27/11 | For Sale | $344,900 | +25.4% | $215 / Sq Ft |
| 08/17/2011 08/17/11 | For Sale | $275,000 | -- | $278 / Sq Ft |
| Year | Tax Paid | Tax Assessment Tax Assessment Total Assessment is a certain percentage of the fair market value that is determined by local assessors to be the total taxable value of land and additions on the property. | Land | Improvement |
|---|---|---|---|---|
| 2025 | $2,512 | $63,660 | $23,520 | $40,140 |
| 2024 | $2,137 | $53,160 | $17,780 | $35,380 |
| 2023 | $2,137 | $56,380 | $18,860 | $37,520 |
| 2022 | $1,842 | $58,960 | $19,720 | $39,240 |
| 2021 | $1,849 | $46,580 | $16,980 | $29,600 |
| 2020 | $1,715 | $44,600 | $16,800 | $27,800 |
| 2019 | $1,640 | $44,600 | $16,800 | $27,800 |
| 2018 | $1,524 | $41,950 | $15,930 | $26,020 |
| 2017 | $1,490 | $41,950 | $15,930 | $26,020 |
| 2016 | $1,358 | $41,660 | $15,220 | $26,440 |
| 2015 | $1,272 | $41,660 | $15,220 | $26,440 |
| 2014 | -- | $37,250 | $14,630 | $22,620 |
| 2013 | -- | $37,250 | $14,630 | $22,620 |
Seller's Agent in 2020
Gillian Arnwine
The Wells Group of Durango, LLC
(970) 749-3704
28 Total Sales
Seller's Agent in 2020
Brittany McCoy
Legacy Properties West Sotheby's Int. Realty
(970) 946-3238
4 in this area
99 Total Sales
Seller's Agent in 2020
Gabi Bergstrom
RE/MAX
(970) 946-7522
13 in this area
164 Total Sales
Buyer's Agent in 2020
Anne Zalbowitz
Keller Williams Realty Southwest Associates, LLC
(970) 769-4892
2 in this area
78 Total Sales
Buyer's Agent in 2020
Max Hutcheson
The Wells Group of Durango, LLC
(970) 375-7014
1 in this area
335 Total Sales
Buyer's Agent in 2020
Linda Buzzalini
Linda Buzzalini, Independent Broker
(970) 749-4249
20 Total Sales
Source: Colorado Real Estate Network (CREN)
MLS Number: 665636
APN: R002683
Disclaimer: Certain information contained herein is derived from information provided by parties other than Homes.com. All information provided is deemed reliable, but is not guaranteed to be accurate and should be independently verified.
![]() IDX information is provided exclusively for personal, non-commercial use, and may not be used for any purpose other than to identify prospective properties consumers may be interested in purchasing. Information is deemed reliable but not guaranteed.
IDX information is provided exclusively for personal, non-commercial use, and may not be used for any purpose other than to identify prospective properties consumers may be interested in purchasing. Information is deemed reliable but not guaranteed.