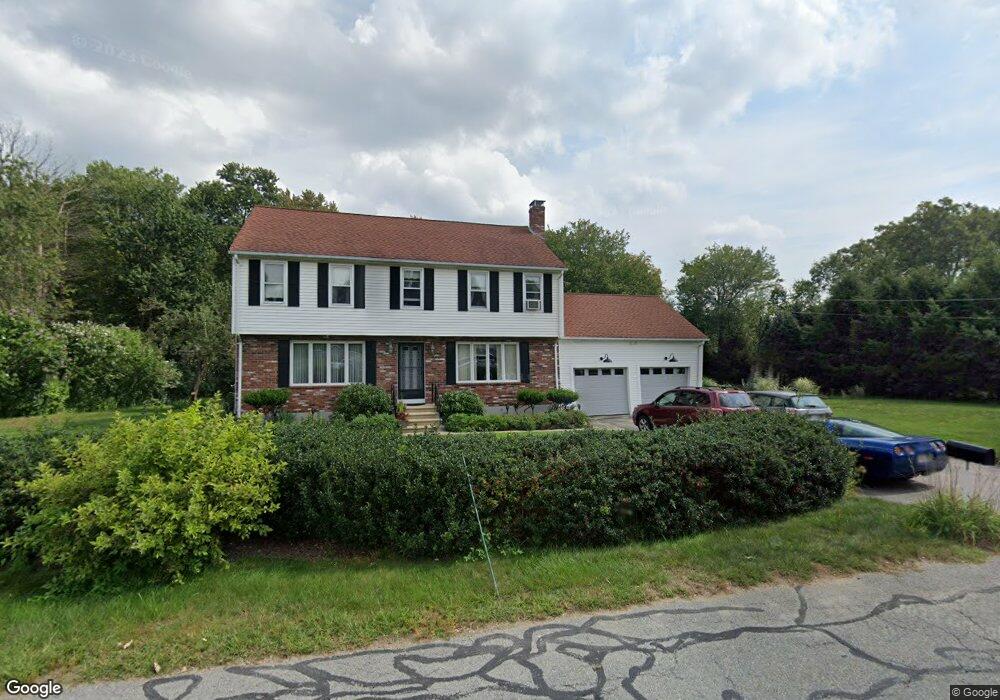
1 James St Milford, MA 01757
Estimated Value: $550,000 - $744,000
4
Beds
4
Baths
3,013
Sq Ft
$217/Sq Ft
Est. Value
About This Home
This home is located at 1 James St, Milford, MA 01757 and is currently estimated at $654,263, approximately $217 per square foot. 1 James St is a home located in Worcester County with nearby schools including Milford High School.
Ownership History
Date
Name
Owned For
Owner Type
Purchase Details
Closed on
Sep 20, 2013
Sold by
Siegel Joel M
Bought by
Niveditaa A Siegel Ret and Siegel Niveditaa A
Current Estimated Value
Purchase Details
Closed on
Jan 16, 2013
Sold by
Siegel Niveditan
Bought by
Niveditaa A Siegal Ret
Purchase Details
Closed on
Nov 24, 1997
Sold by
Paulo Antonio J and Paulo Cristina D
Bought by
Siegel Joel M
Create a Home Valuation Report for This Property
The Home Valuation Report is an in-depth analysis detailing your home's value as well as a comparison with similar homes in the area
Home Values in the Area
Average Home Value in this Area
Purchase History
| Date | Buyer | Sale Price | Title Company |
|---|---|---|---|
| Niveditaa A Siegel Ret | -- | -- | |
| Niveditaa A Siegal Ret | -- | -- | |
| Siegel Joel M | $205,000 | -- |
Source: Public Records
Mortgage History
| Date | Status | Borrower | Loan Amount |
|---|---|---|---|
| Previous Owner | Siegel Joel M | $100,000 | |
| Previous Owner | Siegel Joel M | $100,000 | |
| Previous Owner | Siegel Joel M | $50,000 |
Source: Public Records
Tax History Compared to Growth
Tax History
| Year | Tax Paid | Tax Assessment Tax Assessment Total Assessment is a certain percentage of the fair market value that is determined by local assessors to be the total taxable value of land and additions on the property. | Land | Improvement |
|---|---|---|---|---|
| 2025 | $6,642 | $518,900 | $183,100 | $335,800 |
| 2024 | $6,637 | $499,400 | $175,700 | $323,700 |
| 2023 | $6,205 | $429,400 | $146,400 | $283,000 |
| 2022 | $6,599 | $428,800 | $135,500 | $293,300 |
| 2021 | $6,280 | $393,000 | $135,500 | $257,500 |
| 2020 | $5,573 | $349,200 | $135,500 | $213,700 |
| 2019 | $5,417 | $327,500 | $135,500 | $192,000 |
| 2018 | $5,332 | $322,000 | $130,000 | $192,000 |
| 2017 | $5,210 | $310,300 | $130,000 | $180,300 |
| 2016 | $5,516 | $321,100 | $130,000 | $191,100 |
| 2015 | $4,667 | $265,900 | $80,900 | $185,000 |
Source: Public Records
Map
Nearby Homes
- 12 Alder St
- 16 Gray Squirrel Cir
- 5 Deerfield Rd
- 4 Turin St
- 56 Fisher St
- 16 Lombardi Cir
- 53 Medway Rd
- 9 Tulip Way
- 375 Central St
- 41 Black Bear Cir Unit 41
- 9 Black Bear Cir Unit 9
- 7 Black Bear Unit 7
- 45 Black Bear Cir Unit 45
- 48 Black Bear Cir Unit 48
- 5 Black Bear Cir Unit 5
- 3 Black Bear Cir Unit 3
- 11 Lena Ln Unit 2
- 35 Woodland Ave Unit 35A
- 4 E Charles St
- 15 Free St