Estimated Value: $303,000 - $513,000
4
Beds
2
Baths
1,639
Sq Ft
$265/Sq Ft
Est. Value
About This Home
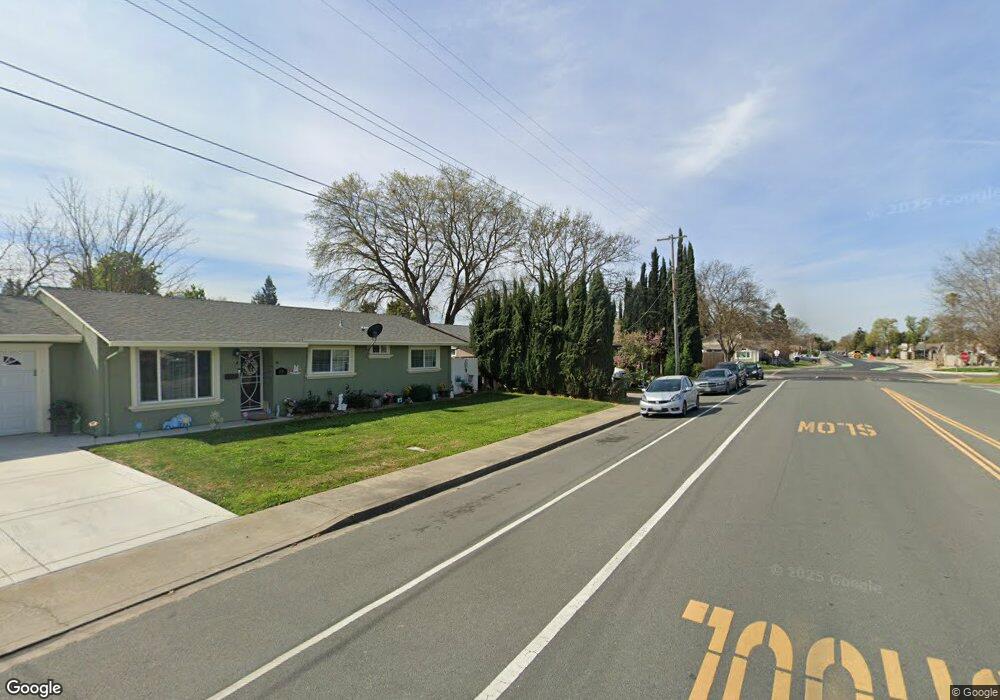
This home is located at 10 C St, Galt, CA 95632 and is currently estimated at $434,815, approximately $265 per square foot. 10 C St is a home located in Sacramento County with nearby schools including Valley Oaks Elementary School, Robert L. McCaffrey Middle School, and Galt High School.
Ownership History
Date
Name
Owned For
Owner Type
Purchase Details
Closed on
Apr 27, 2022
Sold by
Desantiago Diana
Bought by
Desantiago Elvia
Current Estimated Value
Home Financials for this Owner
Home Financials are based on the most recent Mortgage that was taken out on this home.
Original Mortgage
$122,500
Outstanding Balance
$99,210
Interest Rate
3.39%
Mortgage Type
New Conventional
Estimated Equity
$335,605
Purchase Details
Closed on
Nov 26, 2018
Sold by
Desantiago Elvia De
Bought by
Desantiago Diana and Desantiago Elvia
Home Financials for this Owner
Home Financials are based on the most recent Mortgage that was taken out on this home.
Original Mortgage
$139,000
Interest Rate
4.8%
Mortgage Type
New Conventional
Purchase Details
Closed on
Jan 31, 2007
Sold by
Desantiago Dagobeto
Bought by
Desantiago Elvia
Purchase Details
Closed on
Aug 19, 2005
Sold by
Desantiago Dagoberto
Bought by
Ruiz Elvia Yesenia
Create a Home Valuation Report for This Property
The Home Valuation Report is an in-depth analysis detailing your home's value as well as a comparison with similar homes in the area
Home Values in the Area
Average Home Value in this Area
Purchase History
| Date | Buyer | Sale Price | Title Company |
|---|---|---|---|
| Desantiago Elvia | -- | Stewart Title Guaranty Company | |
| Desantiago Diana | -- | Fidelity National Title | |
| Desantiago Elvia | -- | None Available | |
| Desantiago Dagobeto | -- | None Available | |
| Ruiz Elvia Yesenia | -- | -- |
Source: Public Records
Mortgage History
| Date | Status | Borrower | Loan Amount |
|---|---|---|---|
| Open | Desantiago Elvia | $122,500 | |
| Previous Owner | Desantiago Diana | $139,000 |
Source: Public Records
Tax History
| Year | Tax Paid | Tax Assessment Tax Assessment Total Assessment is a certain percentage of the fair market value that is determined by local assessors to be the total taxable value of land and additions on the property. | Land | Improvement |
|---|---|---|---|---|
| 2025 | $2,020 | $190,670 | $69,328 | $121,342 |
| 2024 | $2,020 | $186,932 | $67,969 | $118,963 |
| 2023 | $1,984 | $183,268 | $66,637 | $116,631 |
| 2022 | $1,903 | $179,676 | $65,331 | $114,345 |
| 2021 | $1,903 | $176,153 | $64,050 | $112,103 |
| 2020 | $1,887 | $174,348 | $63,394 | $110,954 |
| 2019 | $1,838 | $170,930 | $62,151 | $108,779 |
| 2018 | $1,834 | $167,580 | $60,933 | $106,647 |
| 2017 | $1,761 | $164,295 | $59,739 | $104,556 |
| 2016 | $1,690 | $161,074 | $58,568 | $102,506 |
| 2015 | $1,631 | $158,656 | $57,689 | $100,967 |
| 2014 | $1,625 | $155,549 | $56,559 | $98,990 |
Source: Public Records
Map
Nearby Homes
- 0 B St Unit 226013319
- 240 3rd St
- 105 Kent St
- 700 2nd St Unit 40
- 700 2nd St Unit 14
- 515 E St
- 150 Spruce Ave
- 667 Germaine Dr
- 214 Cinnamon Dr
- 232 Oak Ave
- 712 Church St
- 246 Oak Ave
- 323 Emerald Oak Dr
- Plan 1609 at Elliott Ranch - Sage
- Plan 2290 at Elliott Ranch - Willow
- Plan 2141 at Elliott Ranch - Sage
- Plan 2015 at Elliott Ranch - Willow
- Plan 1760 at Elliott Ranch - Sage
- Plan 2741 at Elliott Ranch - Willow
- Plan 2280 at Elliott Ranch - Sage
- 14 C St
- 177 Wagon Way
- 155 Branding Iron Way
- 147 Branding Iron Way
- 159 Branding Iron Way
- 18 C St
- 173 Wagon Way
- 143 Branding Iron Way
- 170 Wagon Way
- 161 Saddle Ct
- 169 Wagon Way
- 24 C St
- 139 Branding Iron Way
- 154 Branding Iron Way
- 166 Wagon Way
- 158 Branding Iron Way
- 167 Saddle Ct
- 165 Wagon Way
- 135 Branding Iron Way
- 146 Branding Iron Way
Your Personal Tour Guide
Ask me questions while you tour the home.