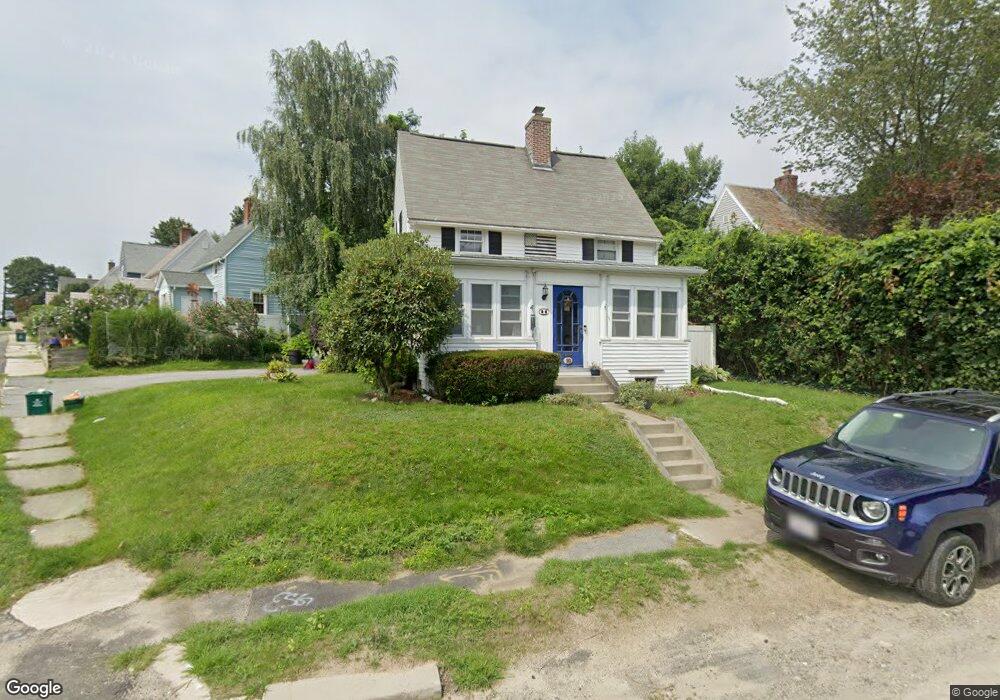
10 Delaval Rd Worcester, MA 01606
Indian Hill NeighborhoodEstimated Value: $378,566 - $487,000
2
Beds
1
Bath
1,080
Sq Ft
$393/Sq Ft
Est. Value
About This Home
This home is located at 10 Delaval Rd, Worcester, MA 01606 and is currently estimated at $424,392, approximately $392 per square foot. 10 Delaval Rd is a home located in Worcester County with nearby schools including Nelson Place Elementary School, Jacob Hiatt Magnet School, and Chandler Magnet.
Ownership History
Date
Name
Owned For
Owner Type
Purchase Details
Closed on
Jun 30, 2004
Sold by
Negron Allison T and Negron Marvin A
Bought by
Campbell Amy E and Campbell John P
Current Estimated Value
Home Financials for this Owner
Home Financials are based on the most recent Mortgage that was taken out on this home.
Original Mortgage
$159,200
Interest Rate
6.3%
Mortgage Type
Purchase Money Mortgage
Purchase Details
Closed on
Jan 28, 1999
Sold by
Rettig Elizabeth
Bought by
Lindermuth Johanna
Home Financials for this Owner
Home Financials are based on the most recent Mortgage that was taken out on this home.
Original Mortgage
$60,256
Interest Rate
6.67%
Mortgage Type
Purchase Money Mortgage
Purchase Details
Closed on
Aug 23, 1996
Sold by
Essex Michael and Essex Maria C
Bought by
Rettig Elizabeth
Purchase Details
Closed on
Aug 31, 1994
Sold by
Davis Eileen and Davis Neil
Bought by
Essex Michael and Essex Maria
Create a Home Valuation Report for This Property
The Home Valuation Report is an in-depth analysis detailing your home's value as well as a comparison with similar homes in the area
Home Values in the Area
Average Home Value in this Area
Purchase History
| Date | Buyer | Sale Price | Title Company |
|---|---|---|---|
| Campbell Amy E | $199,000 | -- | |
| Lindermuth Johanna | $91,000 | -- | |
| Rettig Elizabeth | $79,000 | -- | |
| Essex Michael | $80,000 | -- |
Source: Public Records
Mortgage History
| Date | Status | Borrower | Loan Amount |
|---|---|---|---|
| Open | Essex Michael | $196,471 | |
| Closed | Campbell Amy E | $159,200 | |
| Previous Owner | Essex Michael | $122,000 | |
| Previous Owner | Essex Michael | $60,256 |
Source: Public Records
Tax History
| Year | Tax Paid | Tax Assessment Tax Assessment Total Assessment is a certain percentage of the fair market value that is determined by local assessors to be the total taxable value of land and additions on the property. | Land | Improvement |
|---|---|---|---|---|
| 2025 | $4,183 | $317,100 | $98,500 | $218,600 |
| 2024 | $4,010 | $291,600 | $98,500 | $193,100 |
| 2023 | $3,847 | $268,300 | $85,700 | $182,600 |
| 2022 | $3,538 | $232,600 | $68,600 | $164,000 |
| 2021 | $3,359 | $206,300 | $54,900 | $151,400 |
| 2020 | $3,199 | $188,200 | $54,800 | $133,400 |
| 2019 | $3,071 | $170,600 | $49,300 | $121,300 |
| 2018 | $3,065 | $162,100 | $49,300 | $112,800 |
| 2017 | $2,921 | $152,000 | $49,300 | $102,700 |
| 2016 | $2,892 | $140,300 | $36,700 | $103,600 |
| 2015 | $2,816 | $140,300 | $36,700 | $103,600 |
| 2014 | $2,741 | $140,300 | $36,700 | $103,600 |
Source: Public Records
Map
Nearby Homes
- 41 Mohave Rd
- 37 Mohave Rd
- 120 Brattle St
- 30 Danielles Way
- 270 Brattle St
- 42 N Worcester Ave
- 82 Holden St
- 39 Whitmarsh Ave
- 90 Bjorklund Ave
- 97 Parkton Ave
- 39 Mountainshire Dr
- 25 Chester St
- 667 Grove St
- 169 Whitmarsh Ave
- 15 Ericsson St
- 158 Chester St
- 53 Collins St
- 331 Burncoat St
- 323 Burncoat St
- 12 Tattan Farm Rd
Your Personal Tour Guide
Ask me questions while you tour the home.