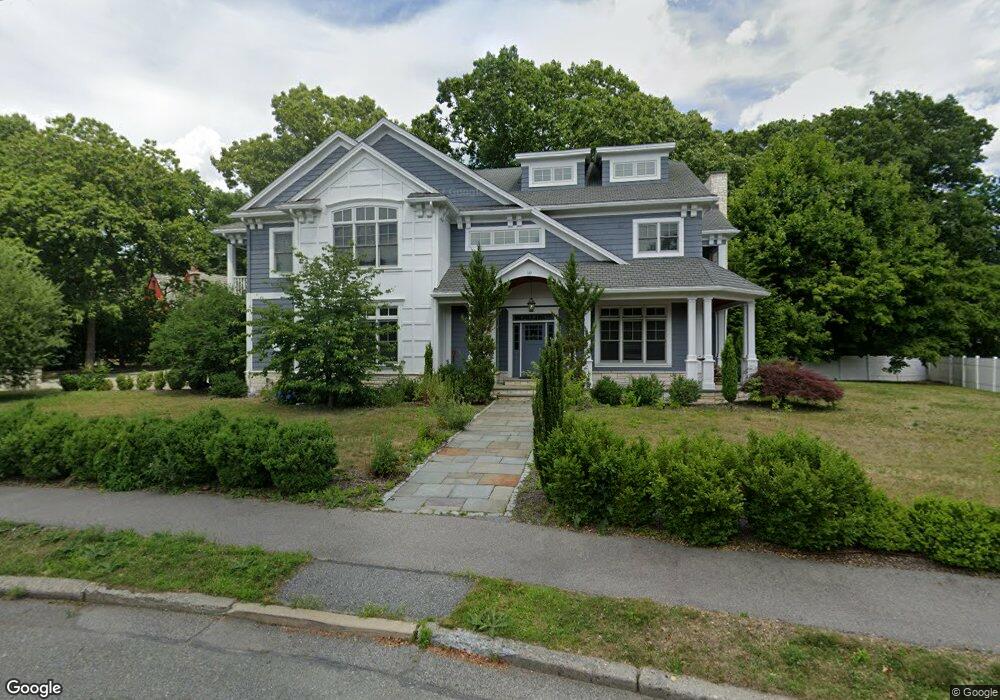
10 Karen Rd Unit 10 Waban, MA 02468
Waban NeighborhoodEstimated Value: $3,851,806 - $4,830,000
3
Beds
3
Baths
1,511
Sq Ft
$2,885/Sq Ft
Est. Value
About This Home
This home is located at 10 Karen Rd Unit 10, Waban, MA 02468 and is currently estimated at $4,359,602, approximately $2,885 per square foot. 10 Karen Rd Unit 10 is a home located in Middlesex County with nearby schools including Angier Elementary School, Charles E Brown Middle School, and Newton South High School.
Ownership History
Date
Name
Owned For
Owner Type
Purchase Details
Closed on
Mar 22, 2019
Sold by
Bai Jinan and Liu Hua
Bought by
Wang Xinying
Current Estimated Value
Purchase Details
Closed on
Jun 1, 2011
Sold by
10 Karen Llc
Bought by
Liu Hua and Bai Jinan
Purchase Details
Closed on
Sep 22, 2010
Sold by
Young Larry F
Bought by
10 Karen Llc
Home Financials for this Owner
Home Financials are based on the most recent Mortgage that was taken out on this home.
Original Mortgage
$1,564,000
Interest Rate
4.48%
Mortgage Type
Purchase Money Mortgage
Purchase Details
Closed on
Aug 21, 1997
Sold by
Est Cohen Walter A and Cohen Richard A
Bought by
Young Larry F
Home Financials for this Owner
Home Financials are based on the most recent Mortgage that was taken out on this home.
Original Mortgage
$333,600
Interest Rate
7.42%
Mortgage Type
Purchase Money Mortgage
Create a Home Valuation Report for This Property
The Home Valuation Report is an in-depth analysis detailing your home's value as well as a comparison with similar homes in the area
Home Values in the Area
Average Home Value in this Area
Purchase History
| Date | Buyer | Sale Price | Title Company |
|---|---|---|---|
| Wang Xinying | $2,635,000 | -- | |
| Liu Hua | $2,300,000 | -- | |
| 10 Karen Llc | $825,000 | -- | |
| Young Larry F | $417,000 | -- |
Source: Public Records
Mortgage History
| Date | Status | Borrower | Loan Amount |
|---|---|---|---|
| Previous Owner | 10 Karen Llc | $1,564,000 | |
| Previous Owner | Young Larry F | $510,000 | |
| Previous Owner | Young Larry F | $333,600 |
Source: Public Records
Tax History Compared to Growth
Tax History
| Year | Tax Paid | Tax Assessment Tax Assessment Total Assessment is a certain percentage of the fair market value that is determined by local assessors to be the total taxable value of land and additions on the property. | Land | Improvement |
|---|---|---|---|---|
| 2025 | $36,348 | $3,709,000 | $1,264,400 | $2,444,600 |
| 2024 | $35,146 | $3,601,000 | $1,227,600 | $2,373,400 |
| 2023 | $34,037 | $3,343,500 | $954,600 | $2,388,900 |
| 2022 | $32,568 | $3,095,800 | $883,900 | $2,211,900 |
| 2021 | $31,426 | $2,920,600 | $833,900 | $2,086,700 |
| 2020 | $30,492 | $2,920,700 | $833,900 | $2,086,800 |
| 2019 | $29,632 | $2,835,600 | $809,600 | $2,026,000 |
| 2018 | $28,921 | $2,672,900 | $731,300 | $1,941,600 |
| 2017 | $28,040 | $2,521,600 | $689,900 | $1,831,700 |
| 2016 | $26,818 | $2,356,600 | $644,800 | $1,711,800 |
| 2015 | $25,570 | $2,202,400 | $602,600 | $1,599,800 |
Source: Public Records
Map
Nearby Homes
- 29 Montclair Rd
- 1430 Beacon St
- 115 Windsor Rd
- 80 Pine Ridge Rd
- 25 Allen Ave
- 20 Kinmonth Rd Unit 203
- 20 Kinmonth Rd Unit 306
- 18 Annawan Rd
- 120 Collins Rd
- 308 Prince St
- 10 Ruane Rd
- 1801 Beacon St
- 35 Kingston Rd
- 1640 Commonwealth Ave
- 39 Valentine Park
- 33 Metacomet Rd
- 120 Stanley Rd
- 131 Oliver Rd
- 34 Pilgrim Rd
- 873 Chestnut St