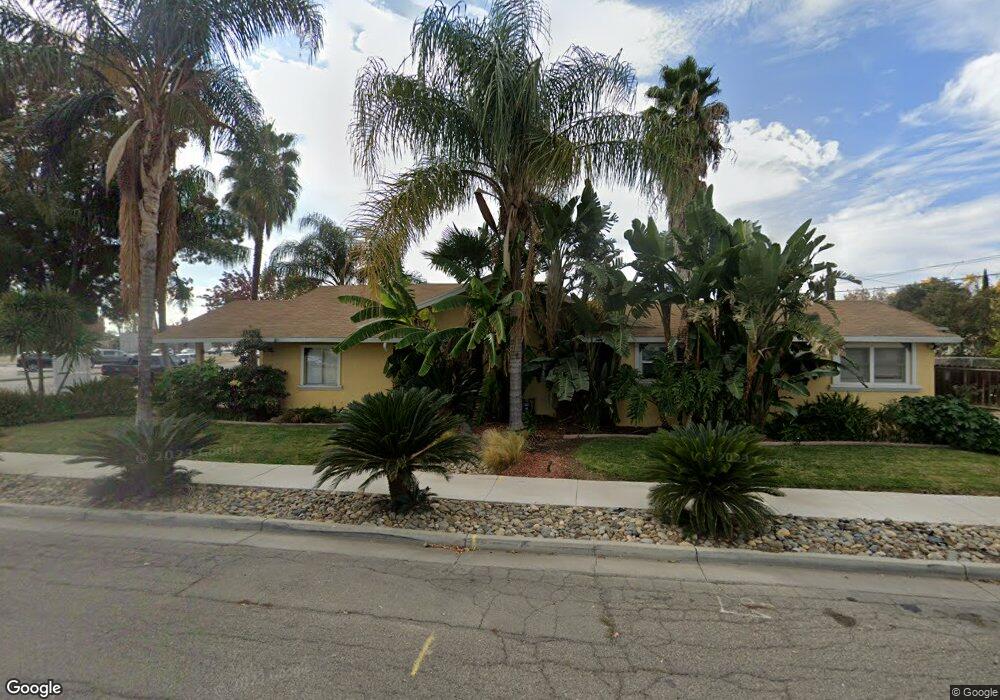
100 N 3rd St Patterson, CA 95363
Estimated Value: $411,000 - $457,000
3
Beds
2
Baths
1,548
Sq Ft
$279/Sq Ft
Est. Value
About This Home
This home is located at 100 N 3rd St, Patterson, CA 95363 and is currently estimated at $431,693, approximately $278 per square foot. 100 N 3rd St is a home located in Stanislaus County with nearby schools including Las Palmas Elementary School, Creekside Middle School, and Patterson High School.
Ownership History
Date
Name
Owned For
Owner Type
Purchase Details
Closed on
Jun 26, 2025
Sold by
Hernandez Bertha Laura
Bought by
Medina Bertha Laura
Current Estimated Value
Home Financials for this Owner
Home Financials are based on the most recent Mortgage that was taken out on this home.
Original Mortgage
$250,000
Outstanding Balance
$242,962
Interest Rate
6.81%
Mortgage Type
New Conventional
Estimated Equity
$188,731
Purchase Details
Closed on
Nov 30, 2007
Sold by
Hernandez Manuel and Hernandez Bertha Laura
Bought by
Hernandez Bertha Laura
Purchase Details
Closed on
Jul 7, 2006
Sold by
Hernandez Manuel
Bought by
Hernandez Manuel and Hernandez Bertha Laura
Purchase Details
Closed on
Mar 16, 2006
Sold by
Hernandez Bertha
Bought by
Hernandez Manuel
Home Financials for this Owner
Home Financials are based on the most recent Mortgage that was taken out on this home.
Original Mortgage
$38,500
Interest Rate
6.25%
Mortgage Type
Credit Line Revolving
Purchase Details
Closed on
Nov 2, 2001
Sold by
Lourenco Antonio Liaboa and Lourenco Maria De Ceu
Bought by
Hernandez Manuel and Hernandez Bertha
Home Financials for this Owner
Home Financials are based on the most recent Mortgage that was taken out on this home.
Original Mortgage
$160,200
Interest Rate
9.62%
Create a Home Valuation Report for This Property
The Home Valuation Report is an in-depth analysis detailing your home's value as well as a comparison with similar homes in the area
Home Values in the Area
Average Home Value in this Area
Purchase History
| Date | Buyer | Sale Price | Title Company |
|---|---|---|---|
| Medina Bertha Laura | -- | Stewart Title Of California | |
| Hernandez Bertha Laura | -- | None Available | |
| Hernandez Manuel | -- | None Available | |
| Hernandez Manuel | -- | Stewart Title California Inc | |
| Hernandez Manuel | $178,000 | Chicago Title Co |
Source: Public Records
Mortgage History
| Date | Status | Borrower | Loan Amount |
|---|---|---|---|
| Open | Medina Bertha Laura | $250,000 | |
| Previous Owner | Hernandez Manuel | $38,500 | |
| Previous Owner | Hernandez Manuel | $160,200 | |
| Closed | Hernandez Manuel | $8,945 |
Source: Public Records
Tax History
| Year | Tax Paid | Tax Assessment Tax Assessment Total Assessment is a certain percentage of the fair market value that is determined by local assessors to be the total taxable value of land and additions on the property. | Land | Improvement |
|---|---|---|---|---|
| 2025 | $3,052 | $262,938 | $70,899 | $192,039 |
| 2024 | $3,043 | $257,783 | $69,509 | $188,274 |
| 2023 | $2,974 | $252,730 | $68,147 | $184,583 |
| 2022 | $2,803 | $247,775 | $66,811 | $180,964 |
| 2021 | $2,764 | $242,917 | $65,501 | $177,416 |
| 2020 | $2,765 | $240,427 | $64,830 | $175,597 |
| 2019 | $2,756 | $238,672 | $63,559 | $175,113 |
| 2018 | $2,634 | $235,096 | $62,313 | $172,783 |
| 2017 | $2,584 | $230,942 | $61,092 | $169,850 |
| 2016 | $2,494 | $224,695 | $59,895 | $164,800 |
| 2015 | $2,164 | $194,426 | $24,000 | $170,426 |
| 2014 | $1,812 | $163,009 | $20,000 | $143,009 |
Source: Public Records
Map
Nearby Homes
- 445 M St
- 192 Torvend Way
- 855 Toyon Ln
- 15707 S 9th St
- 701 N 3rd St
- 647 Ward Ave
- 642 Wanzia Ct
- 517 Nordell Place
- 0 Orange Ave
- 708 Bonneau Ct
- 409 Osprey Dr
- 849 Miraggio Dr
- 216 Barros St
- 1127 Kestrel Dr
- 700 Kinshire Way
- 1430 Walnut Ave
- 140 Ivy Ave Unit A5
- 140 Ivy Ave Unit 39
- 449 D Arpino Ct
- 433 Sanderling Dr
Your Personal Tour Guide
Ask me questions while you tour the home.