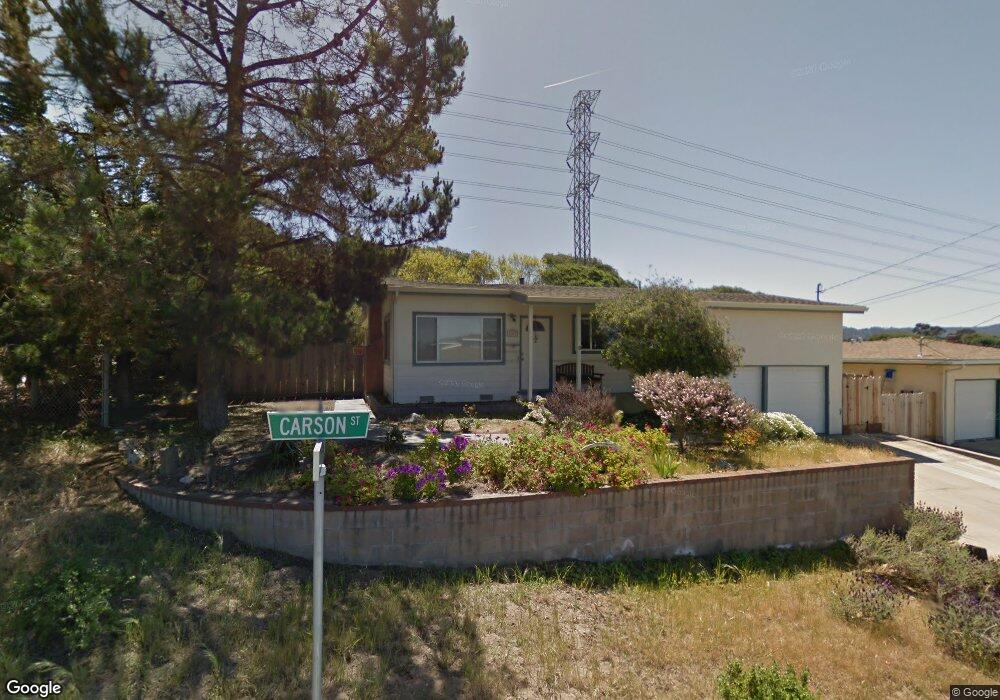
1001 Carson St Seaside, CA 93955
Estimated Value: $864,000 - $929,000
3
Beds
2
Baths
1,157
Sq Ft
$774/Sq Ft
Est. Value
About This Home
This home is located at 1001 Carson St, Seaside, CA 93955 and is currently estimated at $895,025, approximately $773 per square foot. 1001 Carson St is a home located in Monterey County with nearby schools including Del Rey Woods Elementary School, Monte Vista Elementary School, and Monterey High School.
Ownership History
Date
Name
Owned For
Owner Type
Purchase Details
Closed on
Jan 21, 2020
Sold by
Salzer David H
Bought by
Salzer David Henry and David Henry Salzer Trust
Current Estimated Value
Purchase Details
Closed on
Nov 19, 1998
Sold by
Dudley Patricia and Reynolds Daniel J
Bought by
Salzer David H
Home Financials for this Owner
Home Financials are based on the most recent Mortgage that was taken out on this home.
Original Mortgage
$182,400
Outstanding Balance
$40,690
Interest Rate
6.84%
Estimated Equity
$854,335
Purchase Details
Closed on
Dec 27, 1995
Sold by
Reynolds Daniel and Dudley Patricia
Bought by
Dudley Patricia and Reynolds Daniel J
Home Financials for this Owner
Home Financials are based on the most recent Mortgage that was taken out on this home.
Original Mortgage
$151,050
Interest Rate
7.37%
Create a Home Valuation Report for This Property
The Home Valuation Report is an in-depth analysis detailing your home's value as well as a comparison with similar homes in the area
Home Values in the Area
Average Home Value in this Area
Purchase History
| Date | Buyer | Sale Price | Title Company |
|---|---|---|---|
| Salzer David Henry | -- | None Available | |
| Salzer David H | $228,000 | First American Title Co | |
| Dudley Patricia | -- | Old Republic Title Company | |
| Reynolds Daniel | $159,000 | Old Republic Title Company |
Source: Public Records
Mortgage History
| Date | Status | Borrower | Loan Amount |
|---|---|---|---|
| Open | Salzer David H | $182,400 | |
| Previous Owner | Reynolds Daniel | $151,050 |
Source: Public Records
Tax History
| Year | Tax Paid | Tax Assessment Tax Assessment Total Assessment is a certain percentage of the fair market value that is determined by local assessors to be the total taxable value of land and additions on the property. | Land | Improvement |
|---|---|---|---|---|
| 2025 | $3,800 | $357,415 | $195,954 | $161,461 |
| 2024 | $3,800 | $350,408 | $192,112 | $158,296 |
| 2023 | $3,800 | $343,539 | $188,346 | $155,193 |
| 2022 | $3,747 | $336,803 | $184,653 | $152,150 |
| 2021 | $3,693 | $330,200 | $181,033 | $149,167 |
| 2020 | $3,555 | $326,815 | $179,177 | $147,638 |
| 2019 | $3,727 | $320,408 | $175,664 | $144,744 |
| 2018 | $3,581 | $314,126 | $172,220 | $141,906 |
| 2017 | $3,318 | $307,968 | $168,844 | $139,124 |
| 2016 | $3,260 | $301,931 | $165,534 | $136,397 |
| 2015 | $3,213 | $297,397 | $163,048 | $134,349 |
| 2014 | $3,159 | $291,573 | $159,855 | $131,718 |
Source: Public Records
Map
Nearby Homes
- 1 Serrano Way
- 1051 Olympic Ln
- 831 Arlington Place
- 965 Portola Dr
- 810 Altura Place
- 835 Kimball Ave Unit 43
- 1077 Cadiz Ct
- 22 Melway Cir
- 820 Casanova Ave Unit 41
- 820 Casanova Ave Unit 75
- 1148 San Lucas St
- 1233 Hilby Ave
- 241 Lerwick Dr
- 1135 Madera Ct
- 345 Sequoia Ave
- 1212 Trinity Ave Unit 10
- 515 Ramona Ct Unit 1
- 1224 Trinity Ave Unit 14
- 217 Edinburgh Ave
- 17 Los Encinos Dr
Your Personal Tour Guide
Ask me questions while you tour the home.