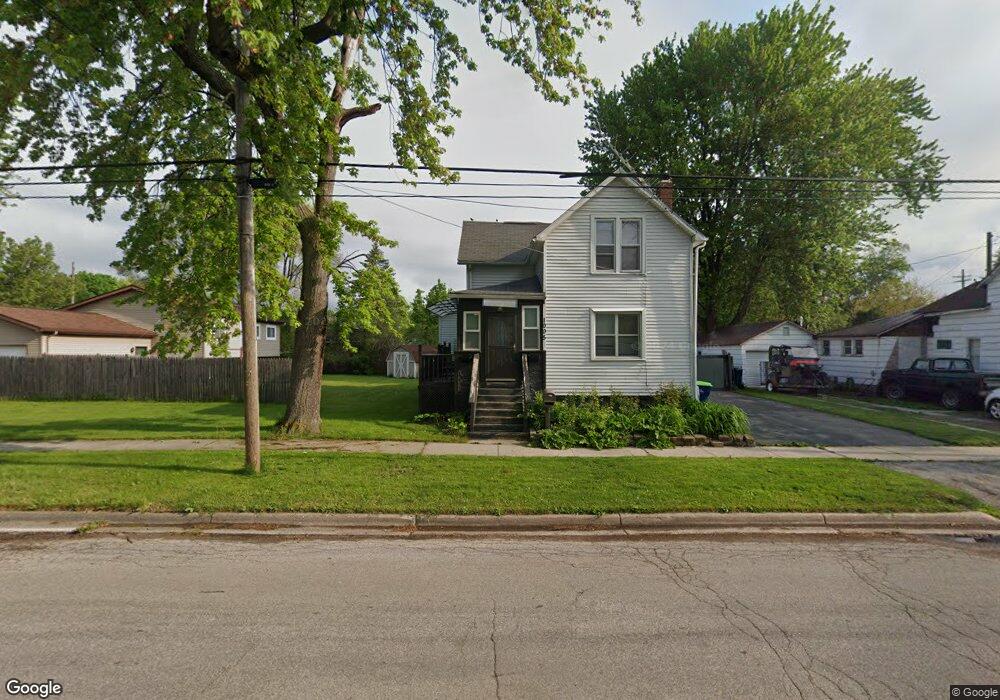
1005 E Smith St Bay City, MI 48706
Estimated Value: $104,000 - $137,000
3
Beds
2
Baths
1,364
Sq Ft
$86/Sq Ft
Est. Value
About This Home
This home is located at 1005 E Smith St, Bay City, MI 48706 and is currently estimated at $117,482, approximately $86 per square foot. 1005 E Smith St is a home located in Bay County with nearby schools including Kolb Elementary School, Handy Middle School, and Bay City Central High School.
Ownership History
Date
Name
Owned For
Owner Type
Purchase Details
Closed on
Feb 2, 2022
Sold by
Fami Appel and Fami Carol
Bought by
Nemarundwe Appel
Current Estimated Value
Purchase Details
Closed on
Dec 17, 2009
Sold by
Secretary Of Housing & Urban Development
Bought by
Fami Appel and Fami Carol
Purchase Details
Closed on
Jul 17, 2009
Sold by
Wells Fargo Bank Na
Bought by
The Secretary Of Housing & Urban Develop
Purchase Details
Closed on
Jan 16, 2009
Sold by
Tippett Bradly J and Tippett Deborah K
Bought by
Wells Fargo Bank Na
Purchase Details
Closed on
Nov 21, 2001
Sold by
Chrobak Stanley and Chrobak Jadwiga
Bought by
Tippett Bradley J and Tippett Deborah K
Create a Home Valuation Report for This Property
The Home Valuation Report is an in-depth analysis detailing your home's value as well as a comparison with similar homes in the area
Home Values in the Area
Average Home Value in this Area
Purchase History
| Date | Buyer | Sale Price | Title Company |
|---|---|---|---|
| Nemarundwe Appel | -- | None Listed On Document | |
| Fami Appel | $12,050 | None Available | |
| The Secretary Of Housing & Urban Develop | -- | None Available | |
| Wells Fargo Bank Na | $82,090 | None Available | |
| Tippett Bradley J | $30,000 | -- |
Source: Public Records
Tax History
| Year | Tax Paid | Tax Assessment Tax Assessment Total Assessment is a certain percentage of the fair market value that is determined by local assessors to be the total taxable value of land and additions on the property. | Land | Improvement |
|---|---|---|---|---|
| 2025 | $1,180 | $47,500 | $0 | $0 |
| 2024 | $1,145 | $42,250 | $0 | $0 |
| 2023 | $1,090 | $36,850 | $0 | $0 |
| 2022 | $1,252 | $33,450 | $0 | $0 |
| 2021 | $1,178 | $31,350 | $31,350 | $0 |
| 2020 | $1,252 | $29,300 | $29,300 | $0 |
| 2019 | $1,225 | $28,150 | $0 | $0 |
| 2018 | $1,213 | $27,900 | $0 | $0 |
| 2017 | $1,187 | $27,700 | $0 | $0 |
| 2016 | $1,180 | $24,150 | $0 | $24,150 |
| 2015 | -- | $23,900 | $0 | $23,900 |
| 2014 | -- | $23,650 | $0 | $23,650 |
Source: Public Records
Map
Nearby Homes
- 100 Smith St
- 1108 Marchand St
- 1109 Leng St
- 801 Marchand St
- 1210 E Smith St
- 905 Murphy Ct
- 1107 Elm St
- 612 Bradfield St
- 2421 & 2435 Marquette Ave
- 1304 Leng St
- 427 James St
- 306 Ottawa St
- 1407 Bradfield St
- 1311 Elm St
- 405 James St
- 222 E Murphy St
- 204 Elm St
- 403 Bradley St
- 118 Ausable State Rd
- 106 Mosher St
Your Personal Tour Guide
Ask me questions while you tour the home.