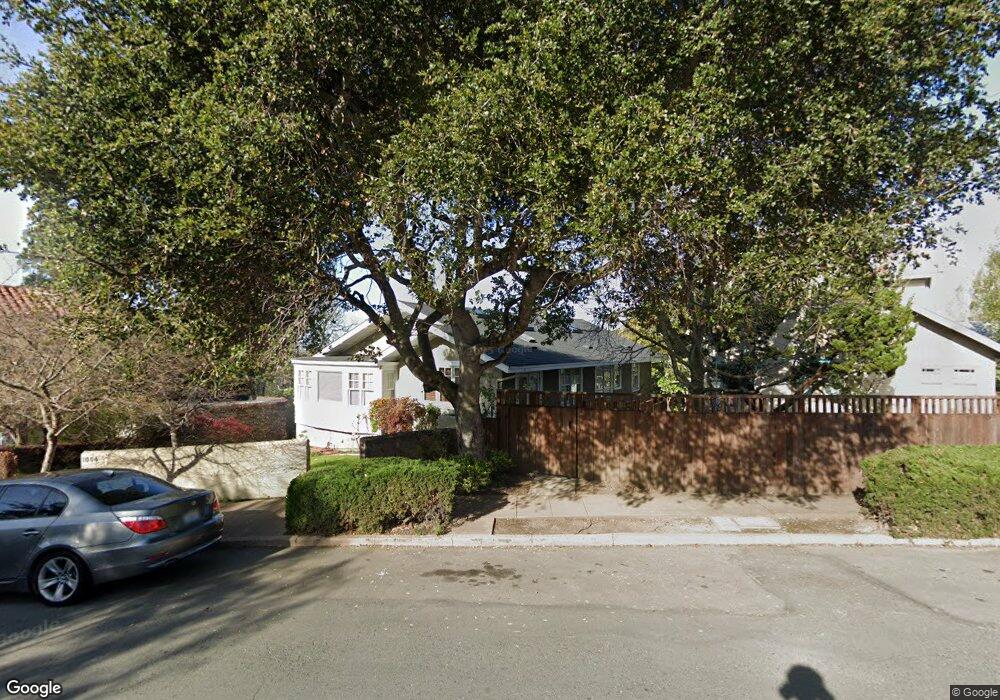
1006 Shattuck Ave Berkeley, CA 94707
Berkeley Hills NeighborhoodEstimated Value: $1,675,000 - $2,179,000
2
Beds
1
Bath
1,683
Sq Ft
$1,191/Sq Ft
Est. Value
About This Home
This home is located at 1006 Shattuck Ave, Berkeley, CA 94707 and is currently estimated at $2,004,897, approximately $1,191 per square foot. 1006 Shattuck Ave is a home located in Alameda County with nearby schools including Cragmont Elementary School, Berkeley Arts Magnet at Whittier School, and Washington Elementary School.
Ownership History
Date
Name
Owned For
Owner Type
Purchase Details
Closed on
Sep 27, 2013
Sold by
Stromberg Margaret T
Bought by
Stromberg Margaret Telonicher and The Margaret Telonicher Stromb
Current Estimated Value
Purchase Details
Closed on
Nov 3, 1998
Sold by
Stromberg Ross E
Bought by
Stromberg Margaret T
Home Financials for this Owner
Home Financials are based on the most recent Mortgage that was taken out on this home.
Original Mortgage
$227,150
Interest Rate
6.61%
Purchase Details
Closed on
Nov 2, 1998
Sold by
Kennedy Edna A
Bought by
Stromberg Margaret T
Home Financials for this Owner
Home Financials are based on the most recent Mortgage that was taken out on this home.
Original Mortgage
$227,150
Interest Rate
6.61%
Create a Home Valuation Report for This Property
The Home Valuation Report is an in-depth analysis detailing your home's value as well as a comparison with similar homes in the area
Home Values in the Area
Average Home Value in this Area
Purchase History
| Date | Buyer | Sale Price | Title Company |
|---|---|---|---|
| Stromberg Margaret Telonicher | -- | None Available | |
| Stromberg Margaret T | -- | Placer Title Company | |
| Stromberg Margaret T | $400,000 | Placer Title Company |
Source: Public Records
Mortgage History
| Date | Status | Borrower | Loan Amount |
|---|---|---|---|
| Previous Owner | Stromberg Margaret T | $227,150 |
Source: Public Records
Tax History
| Year | Tax Paid | Tax Assessment Tax Assessment Total Assessment is a certain percentage of the fair market value that is determined by local assessors to be the total taxable value of land and additions on the property. | Land | Improvement |
|---|---|---|---|---|
| 2025 | $13,236 | $669,228 | $188,114 | $488,114 |
| 2024 | $13,236 | $655,971 | $184,426 | $478,545 |
| 2023 | $12,927 | $649,974 | $180,811 | $469,163 |
| 2022 | $12,619 | $630,231 | $177,266 | $459,965 |
| 2021 | $12,603 | $617,739 | $173,791 | $450,948 |
| 2020 | $11,727 | $618,334 | $172,009 | $446,325 |
| 2019 | $11,051 | $606,212 | $168,637 | $437,575 |
| 2018 | $10,820 | $594,328 | $165,331 | $428,997 |
| 2017 | $10,437 | $582,676 | $162,090 | $420,586 |
| 2016 | $9,963 | $571,253 | $158,912 | $412,341 |
| 2015 | $9,808 | $562,673 | $156,525 | $406,148 |
| 2014 | $9,635 | $551,652 | $153,459 | $398,193 |
Source: Public Records
Map
Nearby Homes
- 938 San Benito Rd
- 1004 Cragmont Ave
- 2121 Eunice St
- 2315 Eunice St
- 1950 Hopkins St
- 813 San Diego Rd
- 962 Regal Rd
- 1106 Cragmont Ave
- 1325 Henry St
- 758 Spruce St
- 777 Cragmont Ave
- 765 San Diego Rd
- 1408 Henry St
- 1983 Yosemite Rd
- 2501 Rose Walk
- 1444 Walnut St
- 1165 Cragmont Ave
- 2686 Shasta Rd
- 1024 Grizzly Peak Blvd
- 1515 Oxford St Unit 1D
- 1010 Shattuck Ave
- 2064 Los Angeles Ave
- 1014 Shattuck Ave
- 1009 Mariposa Ave
- 1003 Mariposa Ave
- 1011 Mariposa Ave
- 2100 Los Angeles Ave
- 1018 Shattuck Ave
- 964 Shattuck Ave
- 1015 Mariposa Ave
- 2104 Los Angeles Ave
- 2063 Los Angeles Ave
- 2101 Los Angeles Ave
- 1011 Shattuck Ave
- 1022 Shattuck Ave
- 2059 Los Angeles Ave
- 1021 Mariposa Ave
- 2105 Los Angeles Ave
- 2112 Los Angeles Ave
- 1015 Shattuck Ave
Your Personal Tour Guide
Ask me questions while you tour the home.