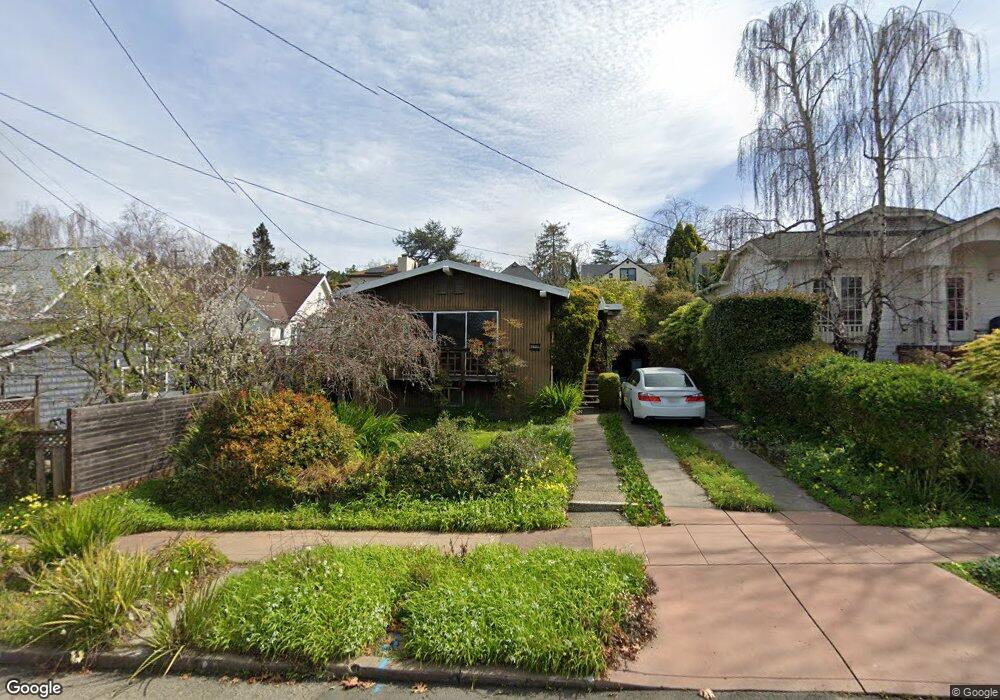
1011 Fresno Ave Berkeley, CA 94707
Northbrae NeighborhoodEstimated Value: $1,383,000 - $1,891,000
3
Beds
2
Baths
1,341
Sq Ft
$1,183/Sq Ft
Est. Value
About This Home
This home is located at 1011 Fresno Ave, Berkeley, CA 94707 and is currently estimated at $1,586,990, approximately $1,183 per square foot. 1011 Fresno Ave is a home located in Alameda County with nearby schools including Thousand Oaks Elementary School, Ruth Acty Elementary, and Berkeley Arts Magnet at Whittier School.
Ownership History
Date
Name
Owned For
Owner Type
Purchase Details
Closed on
Jul 1, 2016
Sold by
Aaronson Wayne and Goto Aaronson Joy
Bought by
Aaronson Wayne and Goto Aaronson Joy
Current Estimated Value
Purchase Details
Closed on
Dec 11, 2003
Sold by
Goto Haru and Goto Family Trust
Bought by
Goto Aaronson Joy
Purchase Details
Closed on
Jun 6, 2002
Sold by
Goto Kazuo and Goto Haru
Bought by
Aaronson Joy Goto and Aaronson Wayne
Purchase Details
Closed on
Dec 10, 2001
Sold by
Goto Kazuo and Goto Haru
Bought by
Aaronson Joy Goto and Aaronson Wayne
Purchase Details
Closed on
Dec 4, 2000
Sold by
Goto Kazuo and Goto Haru
Bought by
Aaronson Joy Goto and Aaronson Wayne
Purchase Details
Closed on
Dec 3, 1999
Sold by
Goto Kazuo Tre and Haru
Bought by
Aaronson Joy Goto and Aaronson Wayne
Purchase Details
Closed on
Jan 3, 1997
Sold by
Goto Kazuo and Goto Haru
Bought by
Aaronson Joy Goto and Aaronson Wayne
Purchase Details
Closed on
Dec 24, 1996
Sold by
Goto Kazuo and Goto Haru
Bought by
Aaronson Joy Goto and Aaronson Wayne
Purchase Details
Closed on
Jul 27, 1996
Sold by
Goto Kazuo and Goto Haru
Bought by
Goto Kazuo and Goto Haru
Create a Home Valuation Report for This Property
The Home Valuation Report is an in-depth analysis detailing your home's value as well as a comparison with similar homes in the area
Home Values in the Area
Average Home Value in this Area
Purchase History
| Date | Buyer | Sale Price | Title Company |
|---|---|---|---|
| Aaronson Wayne | -- | None Available | |
| Goto Aaronson Joy | -- | -- | |
| Aaronson Wayne | -- | -- | |
| Aaronson Joy Goto | -- | -- | |
| Aaronson Joy Goto | -- | -- | |
| Aaronson Joy Goto | -- | -- | |
| Aaronson Joy Goto | -- | -- | |
| Aaronson Joy Goto | -- | -- | |
| Aaronson Joy Goto | -- | -- | |
| Goto Kazuo | -- | -- |
Source: Public Records
Tax History
| Year | Tax Paid | Tax Assessment Tax Assessment Total Assessment is a certain percentage of the fair market value that is determined by local assessors to be the total taxable value of land and additions on the property. | Land | Improvement |
|---|---|---|---|---|
| 2025 | $4,086 | $82,735 | $59,088 | $30,647 |
| 2024 | $4,086 | $80,975 | $57,929 | $30,046 |
| 2023 | $3,918 | $86,250 | $56,793 | $29,457 |
| 2022 | $3,736 | $77,559 | $55,680 | $28,879 |
| 2021 | $3,706 | $75,901 | $54,588 | $28,313 |
| 2020 | $3,424 | $82,052 | $54,029 | $28,023 |
| 2019 | $3,184 | $80,443 | $52,969 | $27,474 |
| 2018 | $3,088 | $78,866 | $51,931 | $26,935 |
| 2017 | $2,952 | $77,320 | $50,913 | $26,407 |
| 2016 | $2,760 | $75,803 | $49,914 | $25,889 |
| 2015 | $2,702 | $74,665 | $49,165 | $25,500 |
| 2014 | $2,639 | $73,203 | $48,202 | $25,001 |
Source: Public Records
Map
Nearby Homes
- 1983 Yosemite Rd
- 826 Indian Rock Ave
- 2121 Eunice St
- 1425 Martin Luther King jr Way
- 1529 Ada St
- 1815 Vine St
- 1509 Francis St
- 770 Santa Barbara Rd
- 1440 Walnut St Unit 5
- 2315 Eunice St
- 731 Santa fe Ave
- 1412 Oxford St
- 1120 Curtis St
- 1444 Walnut St
- 1808 Cedar St
- 1127 Key Route Blvd
- 1609 Bonita Ave Unit 3
- 1609 Bonita Ave Unit 5
- 1610 Milvia St
- 589 San Luis Rd
- 1015 Fresno Ave
- 1828 Marin Ave
- 1824 Marin Ave
- 1017 Fresno Ave
- 1004 The Alameda
- 1008 The Alameda
- 1000 The Alameda
- 1012 The Alameda
- 1835 Monterey Ave
- 1825 Monterey Ave
- 1010 Fresno Ave
- 1014 Fresno Ave
- 1008 Fresno Ave
- 1016 Fresno Ave
- 1000 Fresno Ave
- 1020 Fresno Ave
- 1819 Monterey Ave
- 1818 Marin Ave
- 1841 Marin Ave
Your Personal Tour Guide
Ask me questions while you tour the home.