
Seller's Agent in 2018
Michael Penrod
My Home Group Real Estate
(602) 370-8851
2 Total Sales


Estimated Value: $645,000 - $807,000
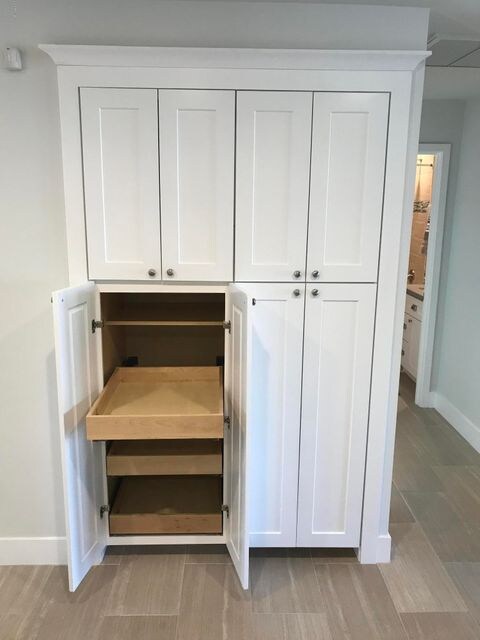
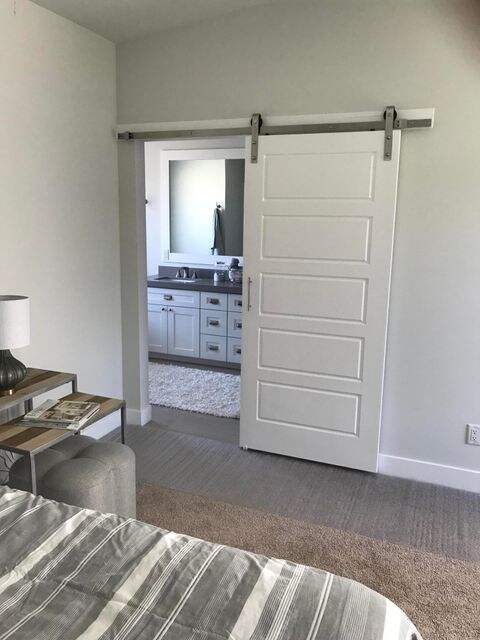
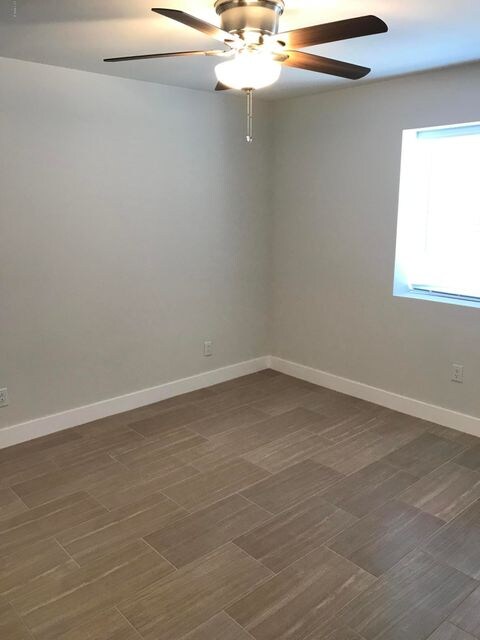
Beautifully remodeled home in the heart of midtown Phoenix. Upscale modern kitchen with gas cooktop, quartz countertops and shaker cabinets. Master bedroom suite features large walk-in closet, free standing tub, and gorgeous walk-in shower. Imagine yourself relaxing in front of the fireplace or on your porch. Minutes from downtown, near shopping, hospitals restaurants, theaters, and more. Act fast and schedule a preview, as this home may be sold soon. 1,000 SF of all new addition. Plumbing, electrical, AC and roof ALL NEW throughout! This home features craftsman design, a BONUS PARTIALLY FINISHED BASEMENT which is 900+ SF of USABLE SPACE NOT INCLUDED in the original 2,104SF living space; SO APPROX TOTAL SQUARE FOOTAGE is CLOSER TO 3,000 SF in this home!
Last Agent to Sell the Property
My Home Group Real Estate License #SA652643000 Listed on: 10/09/2017
| Date | Buyer | Sale Price | Title Company |
|---|---|---|---|
| Puig Javier A | -- | Empire Title Agency | |
| Puig Javier A | -- | None Available | |
| Puig Javier A | $465,000 | Fidelity National Title Agen | |
| Win Capital Llc | -- | None Available | |
| Fox Remodeling Llc | $156,000 | First American Title Ins Co | |
| Watkins Timothy | $140,000 | Security Title Agency | |
| Hazlett Harold J | -- | -- |
| Date | Status | Borrower | Loan Amount |
|---|---|---|---|
| Open | Puig Javier A | $271,500 | |
| Closed | Puig Javier A | $359,000 | |
| Previous Owner | Fox Remodeling Llc | $225,000 | |
| Previous Owner | Watkins Timothy | $143,010 |
| Date | Event | Price | List to Sale | Price per Sq Ft | Prior Sale |
|---|---|---|---|---|---|
| 02/21/2018 02/21/18 | Sold | $465,000 | -2.7% | $221 / Sq Ft | |
| 01/29/2018 01/29/18 | Pending | -- | -- | -- | |
| 01/19/2018 01/19/18 | Price Changed | $477,900 | -0.4% | $227 / Sq Ft | |
| 12/21/2017 12/21/17 | Price Changed | $479,900 | -0.7% | $228 / Sq Ft | |
| 11/30/2017 11/30/17 | Price Changed | $483,500 | -0.2% | $230 / Sq Ft | |
| 11/09/2017 11/09/17 | Price Changed | $484,500 | -1.0% | $230 / Sq Ft | |
| 11/02/2017 11/02/17 | Price Changed | $489,500 | -0.9% | $233 / Sq Ft | |
| 10/25/2017 10/25/17 | Price Changed | $493,975 | -1.0% | $235 / Sq Ft | |
| 10/21/2017 10/21/17 | Price Changed | $498,975 | -0.2% | $237 / Sq Ft | |
| 10/09/2017 10/09/17 | For Sale | $499,999 | +220.5% | $238 / Sq Ft | |
| 03/15/2016 03/15/16 | Sold | $156,000 | +0.6% | $131 / Sq Ft | View Prior Sale |
| 01/24/2016 01/24/16 | Pending | -- | -- | -- | |
| 01/14/2016 01/14/16 | Price Changed | $155,000 | +3.3% | $130 / Sq Ft | |
| 01/12/2016 01/12/16 | Price Changed | $150,000 | -3.8% | $126 / Sq Ft | |
| 01/01/2016 01/01/16 | Price Changed | $155,900 | -0.4% | $131 / Sq Ft | |
| 12/07/2015 12/07/15 | Price Changed | $156,500 | -1.4% | $131 / Sq Ft | |
| 12/04/2015 12/04/15 | Price Changed | $158,800 | +0.6% | $133 / Sq Ft | |
| 11/19/2015 11/19/15 | Price Changed | $157,800 | -0.1% | $132 / Sq Ft | |
| 11/10/2015 11/10/15 | Price Changed | $157,888 | -0.6% | $132 / Sq Ft | |
| 10/30/2015 10/30/15 | Price Changed | $158,900 | -0.6% | $133 / Sq Ft | |
| 10/29/2015 10/29/15 | Price Changed | $159,900 | -0.1% | $134 / Sq Ft | |
| 10/28/2015 10/28/15 | Price Changed | $159,988 | 0.0% | $134 / Sq Ft | |
| 10/26/2015 10/26/15 | Price Changed | $159,998 | 0.0% | $134 / Sq Ft | |
| 10/20/2015 10/20/15 | Price Changed | $159,999 | -3.0% | $134 / Sq Ft | |
| 10/15/2015 10/15/15 | Price Changed | $164,988 | 0.0% | $138 / Sq Ft | |
| 10/09/2015 10/09/15 | For Sale | $164,999 | 0.0% | $138 / Sq Ft | |
| 02/27/2013 02/27/13 | Rented | $858 | -4.6% | -- | |
| 02/25/2013 02/25/13 | Under Contract | -- | -- | -- | |
| 01/03/2013 01/03/13 | For Rent | $899 | 0.0% | -- | |
| 01/14/2012 01/14/12 | Rented | $899 | -18.3% | -- | |
| 01/12/2012 01/12/12 | Under Contract | -- | -- | -- | |
| 12/06/2011 12/06/11 | For Rent | $1,100 | -- | -- |
| Year | Tax Paid | Tax Assessment Tax Assessment Total Assessment is a certain percentage of the fair market value that is determined by local assessors to be the total taxable value of land and additions on the property. | Land | Improvement |
|---|---|---|---|---|
| 2025 | $3,118 | $27,287 | -- | -- |
| 2024 | $2,898 | $25,987 | -- | -- |
| 2023 | $2,898 | $53,670 | $10,730 | $42,940 |
| 2022 | $2,886 | $39,820 | $7,960 | $31,860 |
| 2021 | $2,971 | $34,280 | $6,850 | $27,430 |
| 2020 | $2,890 | $32,000 | $6,400 | $25,600 |
| 2019 | $2,755 | $28,280 | $5,650 | $22,630 |
| 2018 | $685 | $13,450 | $2,690 | $10,760 |
| 2017 | $714 | $10,280 | $2,050 | $8,230 |
| 2016 | $689 | $8,500 | $1,700 | $6,800 |
| 2015 | $559 | $6,880 | $1,370 | $5,510 |
Seller's Agent in 2018
Michael Penrod
My Home Group Real Estate
(602) 370-8851
2 Total Sales
Buyer's Agent in 2018
Beau MacDonnell
eXp Realty
(480) 492-9200
21 Total Sales
Seller's Agent in 2016
Kim Bongiorno
Buyers Information Service, Inc.
(602) 647-4888
49 Total Sales
D
Buyer's Agent in 2016
Danielle LaFata
American Realty Brokers
Source: Arizona Regional Multiple Listing Service (ARMLS)
MLS Number: 5671742
APN: 118-06-099
Disclaimer: Certain information contained herein is derived from information provided by parties other than Homes.com. All information provided is deemed reliable, but is not guaranteed to be accurate and should be independently verified.
![]() All information should be verified by the recipient and none is guaranteed as accurate by ARMLS
All information should be verified by the recipient and none is guaranteed as accurate by ARMLS
Listing Information presented by local MLS brokerage: Ten-X, local REALTOR®- Arlene Richardson - (888)-952-6393
Ask me questions while you tour the home.