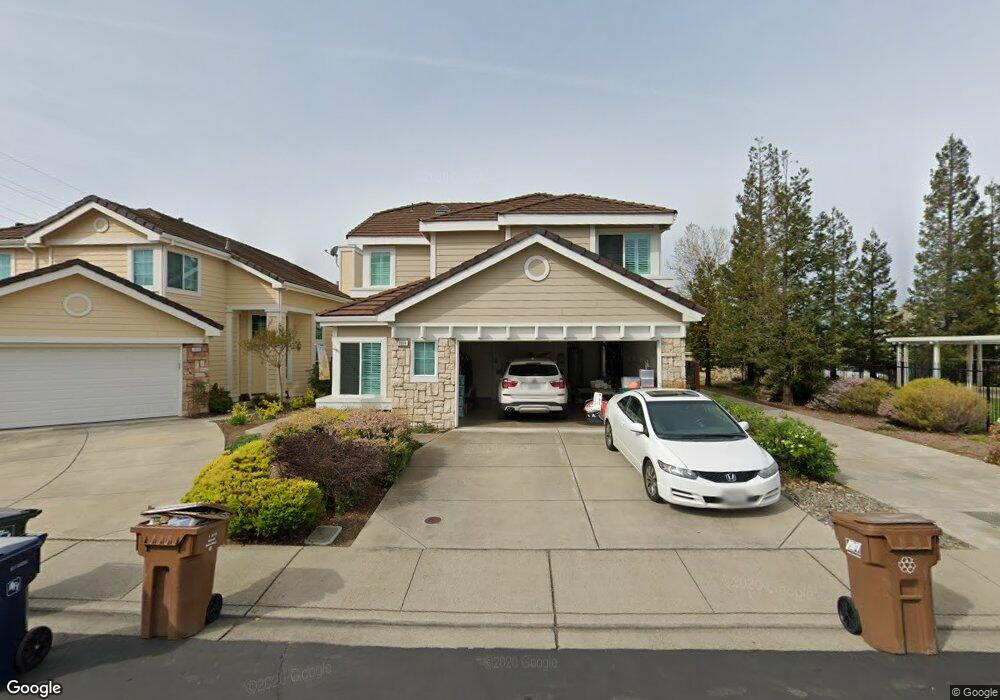
1014 Feather Cir Clayton, CA 94517
Estimated Value: $820,944 - $930,000
3
Beds
3
Baths
1,703
Sq Ft
$513/Sq Ft
Est. Value
About This Home
This home is located at 1014 Feather Cir, Clayton, CA 94517 and is currently estimated at $873,736, approximately $513 per square foot. 1014 Feather Cir is a home located in Contra Costa County with nearby schools including Mt. Diablo Elementary School, Diablo View Middle School, and College Park High School.
Ownership History
Date
Name
Owned For
Owner Type
Purchase Details
Closed on
Dec 18, 2012
Sold by
Daly Kevin and Daly Diana
Bought by
Daly Kevin F and Daly Diana M
Current Estimated Value
Home Financials for this Owner
Home Financials are based on the most recent Mortgage that was taken out on this home.
Original Mortgage
$302,750
Outstanding Balance
$208,766
Interest Rate
3.27%
Mortgage Type
New Conventional
Estimated Equity
$664,970
Purchase Details
Closed on
Mar 29, 2004
Sold by
Daly Kevin F and Daly Diana M
Bought by
Daly Kevin F and Daly Diana M
Purchase Details
Closed on
Jun 6, 1996
Sold by
Presley Homes
Bought by
Daly Kevin F and Daly Diana M
Home Financials for this Owner
Home Financials are based on the most recent Mortgage that was taken out on this home.
Original Mortgage
$191,150
Interest Rate
8.01%
Mortgage Type
Balloon
Create a Home Valuation Report for This Property
The Home Valuation Report is an in-depth analysis detailing your home's value as well as a comparison with similar homes in the area
Home Values in the Area
Average Home Value in this Area
Purchase History
| Date | Buyer | Sale Price | Title Company |
|---|---|---|---|
| Daly Kevin F | -- | First American Title Company | |
| Daly Kevin | -- | First American Title Co | |
| Daly Kevin F | -- | -- | |
| Daly Kevin F | $225,000 | North American Title Co |
Source: Public Records
Mortgage History
| Date | Status | Borrower | Loan Amount |
|---|---|---|---|
| Open | Daly Kevin | $302,750 | |
| Closed | Daly Kevin F | $191,150 |
Source: Public Records
Tax History
| Year | Tax Paid | Tax Assessment Tax Assessment Total Assessment is a certain percentage of the fair market value that is determined by local assessors to be the total taxable value of land and additions on the property. | Land | Improvement |
|---|---|---|---|---|
| 2025 | $5,526 | $373,590 | $143,267 | $230,323 |
| 2024 | $5,153 | $366,265 | $140,458 | $225,807 |
| 2023 | $5,153 | $359,084 | $137,704 | $221,380 |
| 2022 | $5,128 | $352,044 | $135,004 | $217,040 |
| 2021 | $5,038 | $345,142 | $132,357 | $212,785 |
| 2019 | $5,043 | $334,907 | $128,432 | $206,475 |
| 2018 | $4,858 | $328,341 | $125,914 | $202,427 |
| 2017 | $4,698 | $321,904 | $123,446 | $198,458 |
| 2016 | $4,561 | $315,593 | $121,026 | $194,567 |
| 2015 | $4,473 | $310,854 | $119,209 | $191,645 |
| 2014 | $4,383 | $304,765 | $116,874 | $187,891 |
Source: Public Records
Map
Nearby Homes
- 1383 Shell Ln
- 5617 Bettencourt Dr
- 249 Stranahan Cir
- 3 Rachel Ranch Ct
- 1921 Eagle Peak Ave Unit 28
- 1048 Panadero Ct
- 5612 Frank Place
- 376 Blue Oak Ln
- 5 Pardi Ln
- 1421 Lydia Ln
- 1897 Camino Estrada
- 5849 Mitchell Canyon Ct
- 5581 Gonzalez Ct
- 1833 Camino Estrada
- 1506 N El Camino Dr
- 5817 Mitchell Canyon Ct
- 1394 El Camino Dr
- 105 Crow Place
- 218 Mountaire Cir
- 5454 Anselmo Ct
- 1016 Feather Cir
- 1016 Feather CI
- 1012 Feather Cir
- 1028 Feather Cir
- 1032 Feather Cir
- 1074 Feather Cir Unit 2B
- 1034 Feather Cir
- 1015 Feather Cir
- 1011 Feather Cir
- 1017 Feather Cir
- 1009 Feather Cir
- 1007 Feather Cir
- 1072 Feather Cir
- 1019 Feather Cir
- 1005 Feather Cir
- 1048 Feather Cir
- 1038 Feather Cir
- 1050 Feather Cir Unit 2B
- 1029 Feather Cir
- 1070 Feather Cir
Your Personal Tour Guide
Ask me questions while you tour the home.