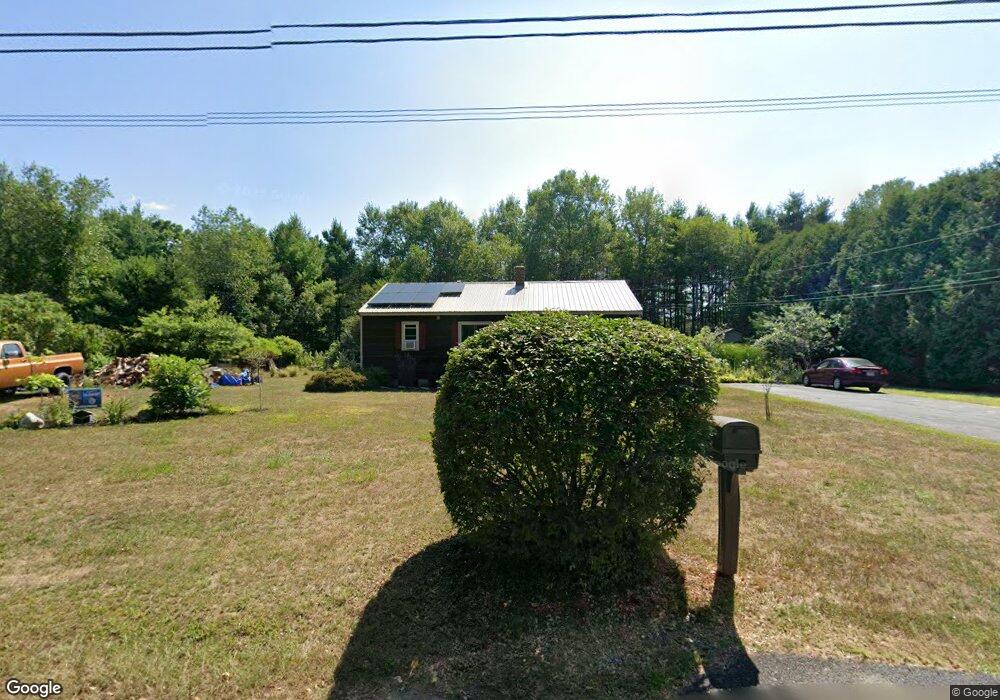
102 Memory Ln Orange, MA 01364
Estimated Value: $325,000 - $414,000
3
Beds
1
Bath
1,040
Sq Ft
$341/Sq Ft
Est. Value
About This Home
This home is located at 102 Memory Ln, Orange, MA 01364 and is currently estimated at $354,792, approximately $341 per square foot. 102 Memory Ln is a home located in Franklin County with nearby schools including Fisher Hill and Ralph C Mahar Regional School.
Ownership History
Date
Name
Owned For
Owner Type
Purchase Details
Closed on
Jan 16, 2004
Sold by
Sinclair Cheryl L and Orourke Cheryl
Bought by
Fortes Gregory E
Current Estimated Value
Home Financials for this Owner
Home Financials are based on the most recent Mortgage that was taken out on this home.
Original Mortgage
$146,350
Outstanding Balance
$68,822
Interest Rate
5.98%
Mortgage Type
Purchase Money Mortgage
Estimated Equity
$285,970
Create a Home Valuation Report for This Property
The Home Valuation Report is an in-depth analysis detailing your home's value as well as a comparison with similar homes in the area
Home Values in the Area
Average Home Value in this Area
Purchase History
| Date | Buyer | Sale Price | Title Company |
|---|---|---|---|
| Fortes Gregory E | $143,500 | -- |
Source: Public Records
Mortgage History
| Date | Status | Borrower | Loan Amount |
|---|---|---|---|
| Open | Fortes Gregory E | $146,350 |
Source: Public Records
Tax History
| Year | Tax Paid | Tax Assessment Tax Assessment Total Assessment is a certain percentage of the fair market value that is determined by local assessors to be the total taxable value of land and additions on the property. | Land | Improvement |
|---|---|---|---|---|
| 2025 | $50 | $302,700 | $32,000 | $270,700 |
| 2024 | $4,407 | $252,700 | $32,000 | $220,700 |
| 2023 | $4,183 | $232,900 | $32,000 | $200,900 |
| 2022 | $3,906 | $204,300 | $32,000 | $172,300 |
| 2021 | $3,541 | $176,600 | $53,900 | $122,700 |
| 2020 | $3,470 | $170,700 | $53,600 | $117,100 |
| 2019 | $3,187 | $141,500 | $48,000 | $93,500 |
| 2018 | $3,045 | $138,800 | $47,300 | $91,500 |
| 2017 | $2,947 | $138,800 | $47,300 | $91,500 |
| 2016 | $2,971 | $136,900 | $47,300 | $89,600 |
| 2015 | $2,796 | $134,600 | $47,300 | $87,300 |
| 2014 | $2,720 | $137,800 | $47,300 | $90,500 |
Source: Public Records
Map
Nearby Homes
Your Personal Tour Guide
Ask me questions while you tour the home.