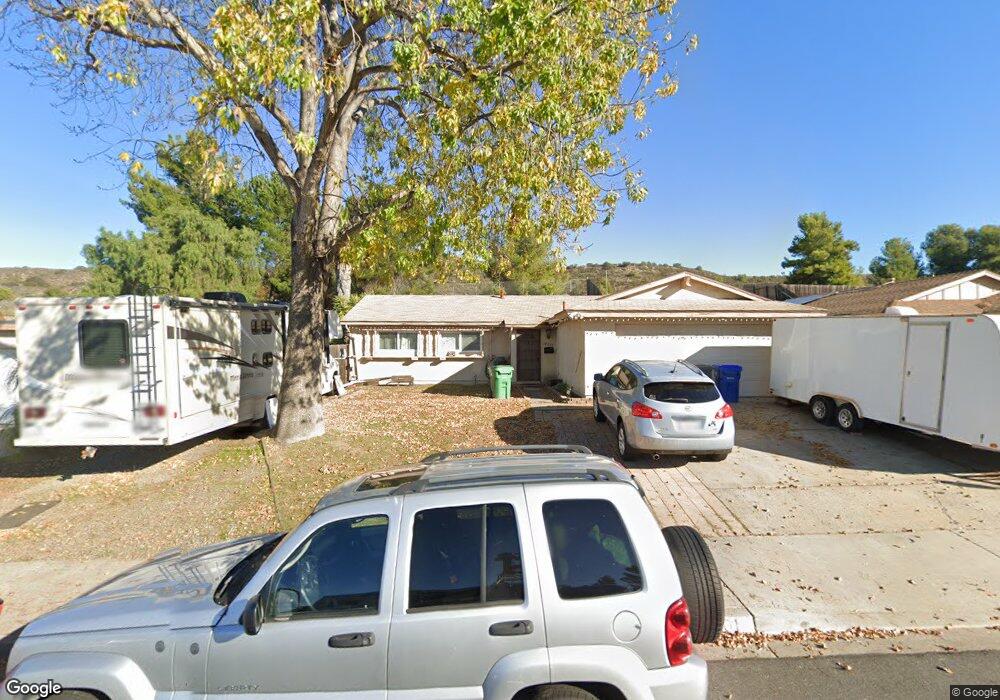
10201 Swanton Dr Santee, CA 92071
Carlton Hills NeighborhoodEstimated Value: $806,000 - $839,000
3
Beds
2
Baths
1,320
Sq Ft
$624/Sq Ft
Est. Value
About This Home
This home is located at 10201 Swanton Dr, Santee, CA 92071 and is currently estimated at $823,408, approximately $623 per square foot. 10201 Swanton Dr is a home located in San Diego County with nearby schools including Sycamore Canyon Elementary School and West Hills High School.
Ownership History
Date
Name
Owned For
Owner Type
Purchase Details
Closed on
Jul 27, 2021
Sold by
Blaylock Jeffrey and Blaylock Christine Ann
Bought by
Blaylock Jeffrey T and Blaylock Christine
Current Estimated Value
Purchase Details
Closed on
Jul 8, 2005
Sold by
Blaylock Jeffrey and Blaylock Christine Ann I
Bought by
Blaylock Jeffrey and Blaylock Christine Ann I
Home Financials for this Owner
Home Financials are based on the most recent Mortgage that was taken out on this home.
Original Mortgage
$416,000
Outstanding Balance
$220,095
Interest Rate
5.87%
Mortgage Type
Purchase Money Mortgage
Estimated Equity
$603,313
Purchase Details
Closed on
Mar 25, 1999
Sold by
Sciotto Joseph L and Sciotto Pamela J
Bought by
Blaylock Jeffrey T and Blaylock Christine Ann I
Home Financials for this Owner
Home Financials are based on the most recent Mortgage that was taken out on this home.
Original Mortgage
$171,268
Interest Rate
7.1%
Mortgage Type
FHA
Purchase Details
Closed on
Sep 2, 1988
Create a Home Valuation Report for This Property
The Home Valuation Report is an in-depth analysis detailing your home's value as well as a comparison with similar homes in the area
Home Values in the Area
Average Home Value in this Area
Purchase History
| Date | Buyer | Sale Price | Title Company |
|---|---|---|---|
| Blaylock Jeffrey T | -- | None Available | |
| Blaylock Jeffrey | -- | Alliance Title Company | |
| Blaylock Jeffrey T | $177,500 | Fidelity National Title | |
| -- | $112,000 | -- |
Source: Public Records
Mortgage History
| Date | Status | Borrower | Loan Amount |
|---|---|---|---|
| Open | Blaylock Jeffrey | $416,000 | |
| Closed | Blaylock Jeffrey T | $171,268 |
Source: Public Records
Tax History
| Year | Tax Paid | Tax Assessment Tax Assessment Total Assessment is a certain percentage of the fair market value that is determined by local assessors to be the total taxable value of land and additions on the property. | Land | Improvement |
|---|---|---|---|---|
| 2025 | $3,303 | $278,238 | $95,416 | $182,822 |
| 2024 | $3,303 | $272,784 | $93,546 | $179,238 |
| 2023 | $3,201 | $267,436 | $91,712 | $175,724 |
| 2022 | $3,174 | $262,193 | $89,914 | $172,279 |
| 2021 | $3,128 | $257,052 | $88,151 | $168,901 |
| 2020 | $3,089 | $254,418 | $87,248 | $167,170 |
| 2019 | $2,981 | $249,431 | $85,538 | $163,893 |
| 2018 | $2,919 | $244,541 | $83,861 | $160,680 |
| 2017 | $160 | $239,747 | $82,217 | $157,530 |
| 2016 | $2,791 | $235,047 | $80,605 | $154,442 |
| 2015 | $2,753 | $231,518 | $79,395 | $152,123 |
| 2014 | $2,697 | $226,984 | $77,840 | $149,144 |
Source: Public Records
Map
Nearby Homes
- 10118 Swanton Dr
- 9213 Fenway Rd
- 10354 Settle Rd
- 10504 Strathmore Dr
- 9542 Markwood Dr
- 9649 Derald Rd
- 9722 Roe Dr
- 9462 Doheny Rd
- 9410 Pike Rd
- 9243 Stoyer Dr
- 9409 Pike Rd
- 8810 Wigwam Ct
- 8514 Boulder Way
- 9401 Carlton Oaks Dr Unit E
- 405 Whispering Willow Dr Unit E
- 9942 Theresa Ln
- 10634 Sanfred Ct
- 10143 Maple Tree Rd
- 9048 Willowgrove Place
- 10621 Keith St
- 10207 Swanton Dr
- 10177 Swanton Dr
- 10211 Swanton Dr
- 10171 Swanton Dr
- 10217 Swanton Dr
- 10167 Swanton Dr
- 10208 Swanton Dr
- 10202 Swanton Dr
- 10176 Swanton Dr
- 10218 Swanton Dr
- 10221 Swanton Dr
- 10161 Swanton Dr
- 10168 Swanton Dr
- 10164 Swanton Dr
- 10227 Swanton Dr
- 10157 Swanton Dr
- 9353 Las Lomas Dr
- 10160 Swanton Dr
- 9343 Las Lomas Dr
- 10224 Swanton Dr
Your Personal Tour Guide
Ask me questions while you tour the home.