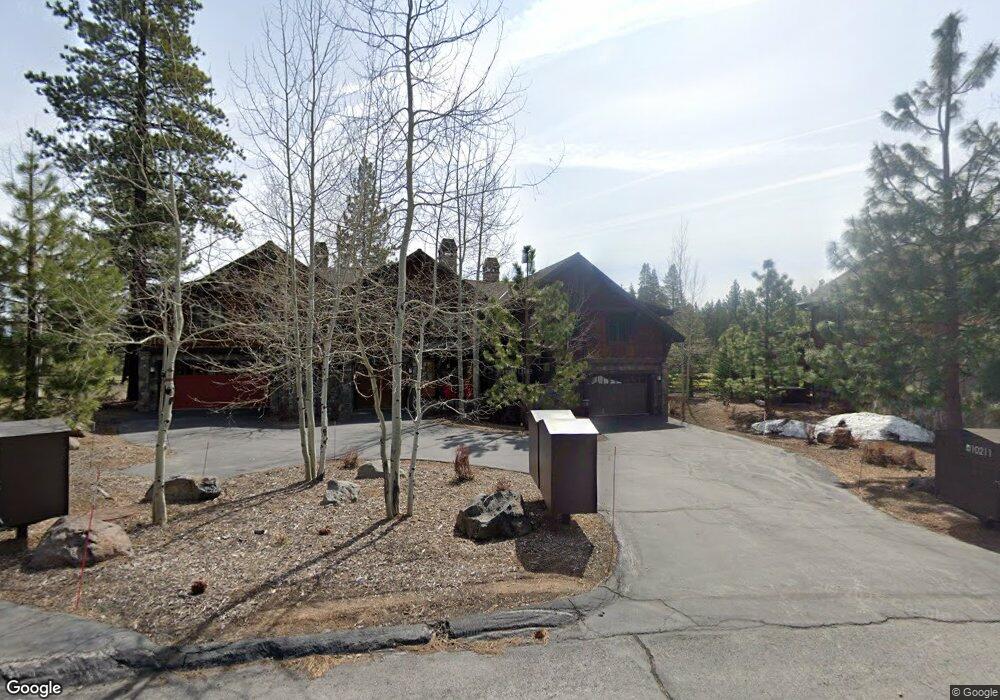
10211 Annies Loop Truckee, CA 96161
Estimated Value: $1,037,000 - $1,271,114
3
Beds
4
Baths
2,173
Sq Ft
$545/Sq Ft
Est. Value
About This Home
This home is located at 10211 Annies Loop, Truckee, CA 96161 and is currently estimated at $1,185,029, approximately $545 per square foot. 10211 Annies Loop is a home located in Nevada County with nearby schools including Glenshire Elementary School, Alder Creek Middle School, and Tahoe Truckee High School.
Ownership History
Date
Name
Owned For
Owner Type
Purchase Details
Closed on
Sep 16, 2020
Sold by
Annies Loop 10215 Llc
Bought by
Lehrer Graiwer Joshua Eli and The Lipson & Lepson Graiwer Fa
Current Estimated Value
Purchase Details
Closed on
Aug 29, 2017
Sold by
Kozlak Nicholas J
Bought by
Kozlak Nicholas J and Kozlak Jodeen A
Purchase Details
Closed on
Aug 28, 2017
Sold by
Kozlak Nicholas J and Kozlak Jodeen A
Bought by
Annises 10215 Llc
Purchase Details
Closed on
Jun 21, 2016
Sold by
Kozlak Jodeen A
Bought by
Kozlak Nicholas J
Purchase Details
Closed on
Dec 28, 2012
Sold by
The Village At Grays Crossing Lp
Bought by
Clauson Jason R
Home Financials for this Owner
Home Financials are based on the most recent Mortgage that was taken out on this home.
Original Mortgage
$465,500
Interest Rate
3.27%
Mortgage Type
New Conventional
Create a Home Valuation Report for This Property
The Home Valuation Report is an in-depth analysis detailing your home's value as well as a comparison with similar homes in the area
Purchase History
| Date | Buyer | Sale Price | Title Company |
|---|---|---|---|
| Lehrer Graiwer Joshua Eli | $930,000 | Fidelity Natl Ttl Co Of Ca | |
| Kozlak Nicholas J | -- | None Available | |
| Annises 10215 Llc | -- | None Available | |
| Kozlak Nicholas J | -- | Placer Title Company | |
| Kozlak Nicholas J | $880,000 | Placer Title Company | |
| Clauson Jason R | $665,000 | Fidelity National Title Comp |
Source: Public Records
Mortgage History
| Date | Status | Borrower | Loan Amount |
|---|---|---|---|
| Previous Owner | Clauson Jason R | $465,500 |
Source: Public Records
Tax History
| Year | Tax Paid | Tax Assessment Tax Assessment Total Assessment is a certain percentage of the fair market value that is determined by local assessors to be the total taxable value of land and additions on the property. | Land | Improvement |
|---|---|---|---|---|
| 2025 | $14,718 | $1,006,660 | $108,242 | $898,418 |
| 2024 | $14,576 | $986,922 | $106,120 | $880,802 |
| 2023 | $14,576 | $967,572 | $104,040 | $863,532 |
| 2022 | $14,229 | $948,600 | $102,000 | $846,600 |
| 2021 | $13,699 | $930,000 | $100,000 | $830,000 |
| 2020 | $13,727 | $933,862 | $106,120 | $827,742 |
| 2019 | $13,705 | $915,552 | $104,040 | $811,512 |
| 2018 | $0 | $897,600 | $102,000 | $795,600 |
| 2017 | $12,689 | $880,000 | $100,000 | $780,000 |
| 2016 | $10,588 | $691,755 | $52,011 | $639,744 |
| 2015 | $10,351 | $681,365 | $51,230 | $630,135 |
| 2014 | -- | $668,019 | $50,227 | $617,792 |
Source: Public Records
Map
Nearby Homes
- 10213 Annies Loop
- 10117 Jake's Way
- 10061 Jake's Way
- 11614 Henness Rd Unit Share B
- 10624 & 10625 Rue Ivy
- 10576 Brickell Ct
- 11210 Henness Rd
- 11454 Henness Rd
- 11791 Ghirard Rd
- 11771 Ghirard Rd
- 11585 China Camp Rd
- 10789 Labelle Ct
- 10100 Pioneer Trail Unit 63
- 10100 Pioneer Trail Unit 101
- 11841 Bottcher Loop
- 11097 Comstock Place
- 11925 Saddleback Dr
- 12062 Saddleback Dr
- 11761 Bottcher Loop
- 11102 Meek Ct
- 10211 Annies Loop Unit 11 Fairway Townhome
- 10211 Annies Loop Unit 11 Village @ GC
- 10211 Annies Loop
- 10213 Annies Loop Unit 10 Fairway Townhome
- 10213 Annies Loop Unit 10 Village @ Gray's
- 10215 Annies Loop Unit 9 Village at Gray's
- 10215 Annies Loop Unit 9 Fairway Townhomes
- 10215 Annies Loop
- 10201 Annies Loop Unit B4
- 10201 Annies Loop Unit 12
- 10201 Annies Loop
- 10199 Annies Loop
- 10199 Annies Loop Unit 13
- 10227 Annies Loop Unit A8
- A2 Annies Loop Unit A2
- A3 Annies Loop Unit A3
- A1 Annies Loop Unit A1
- 10189 Annies Loop
- 10229 Annies Loop Unit A7
- 10187 Annies Loop
Your Personal Tour Guide
Ask me questions while you tour the home.