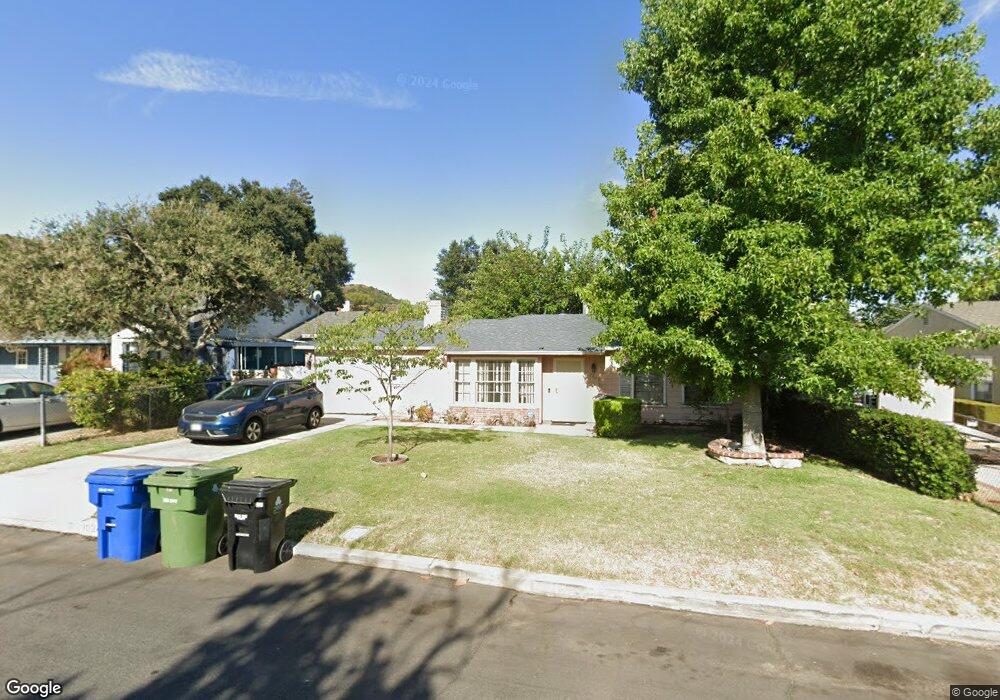
10245 Parr Ave Sunland, CA 91040
Sunland NeighborhoodEstimated Value: $737,030 - $886,000
2
Beds
1
Bath
883
Sq Ft
$916/Sq Ft
Est. Value
About This Home
This home is located at 10245 Parr Ave, Sunland, CA 91040 and is currently estimated at $809,008, approximately $916 per square foot. 10245 Parr Ave is a home located in Los Angeles County with nearby schools including Apperson Street Elementary School, Mt. Gleason Middle School, and Verdugo Hills Senior High School.
Ownership History
Date
Name
Owned For
Owner Type
Purchase Details
Closed on
Mar 13, 2002
Sold by
Belofsky Rachel
Bought by
Belofsky Rachel and Belofsky Leonard
Current Estimated Value
Home Financials for this Owner
Home Financials are based on the most recent Mortgage that was taken out on this home.
Original Mortgage
$185,000
Outstanding Balance
$77,388
Interest Rate
7.08%
Estimated Equity
$731,620
Purchase Details
Closed on
Oct 23, 2000
Sold by
Belofsky Leonard
Bought by
Belofsky Rachel and Belofsky Leonard
Purchase Details
Closed on
Sep 13, 2000
Sold by
Lee Erik
Bought by
Lee Jan Pinho and Pinho Jan C
Home Financials for this Owner
Home Financials are based on the most recent Mortgage that was taken out on this home.
Original Mortgage
$186,200
Interest Rate
7.98%
Purchase Details
Closed on
Aug 18, 2000
Sold by
Pinho Jan C
Bought by
Belofsky Leonard and Belofsky Celia
Home Financials for this Owner
Home Financials are based on the most recent Mortgage that was taken out on this home.
Original Mortgage
$186,200
Interest Rate
7.98%
Create a Home Valuation Report for This Property
The Home Valuation Report is an in-depth analysis detailing your home's value as well as a comparison with similar homes in the area
Home Values in the Area
Average Home Value in this Area
Purchase History
| Date | Buyer | Sale Price | Title Company |
|---|---|---|---|
| Belofsky Rachel | -- | Commonwealth Land Title Co | |
| Belofsky Rachel | -- | Old Republic Title Company | |
| Lee Jan Pinho | -- | Old Republic Title Company | |
| Belofsky Leonard | $196,000 | Old Republic Title Company |
Source: Public Records
Mortgage History
| Date | Status | Borrower | Loan Amount |
|---|---|---|---|
| Open | Belofsky Rachel | $185,000 | |
| Previous Owner | Belofsky Leonard | $186,200 |
Source: Public Records
Tax History
| Year | Tax Paid | Tax Assessment Tax Assessment Total Assessment is a certain percentage of the fair market value that is determined by local assessors to be the total taxable value of land and additions on the property. | Land | Improvement |
|---|---|---|---|---|
| 2025 | $3,588 | $295,318 | $197,234 | $98,084 |
| 2024 | $3,588 | $289,528 | $193,367 | $96,161 |
| 2023 | $3,519 | $283,852 | $189,576 | $94,276 |
| 2022 | $3,356 | $278,287 | $185,859 | $92,428 |
| 2021 | $3,311 | $272,831 | $182,215 | $90,616 |
| 2019 | $3,211 | $264,740 | $176,811 | $87,929 |
| 2018 | $3,159 | $259,550 | $173,345 | $86,205 |
| 2016 | $3,012 | $249,473 | $166,615 | $82,858 |
| 2015 | $2,967 | $245,727 | $164,113 | $81,614 |
| 2014 | $2,984 | $240,915 | $160,899 | $80,016 |
Source: Public Records
Map
Nearby Homes
- 10227 Parr Ave
- 10323 Eldora Ave
- 10338 Oro Vista Ave
- 10143 Oro Vista Ave
- 10412 Eldora Ave
- 8100 Foothill Blvd Unit 1
- 8100 Foothill Blvd Unit 3
- 8455 Mcgroarty St
- 8420 Mcgroarty St
- 8323 Grenoble St Unit 32
- 8554 Day St
- 10535 Nassau Ave
- 8600 Day St
- 8444 Grenoble St
- 10347 Newhome Ave
- 7916 Glenties Ln
- 10155 Mount Gleason Ave
- 8230 Kyle St
- 10607 Whitegate Ave
- 8720 Wyngate St
- 10239 Parr Ave
- 10251 Parr Ave
- 10244 Scoville Ave
- 10233 Parr Ave
- 10257 Parr Ave
- 10250 Scoville Ave
- 10234 Scoville Ave
- 10242 Scoville Ave
- 10244 Parr Ave
- 10256 Scoville Ave
- 10250 Parr Ave
- 10238 Parr Ave
- 10232 Parr Ave
- 10256 Parr Ave
- 10226 Scoville Ave
- 10221 Parr Ave
- 10226 Parr Ave
- 10303 Parr Ave
- 10245 Scoville Ave
- 10245 Odell Ave
Your Personal Tour Guide
Ask me questions while you tour the home.