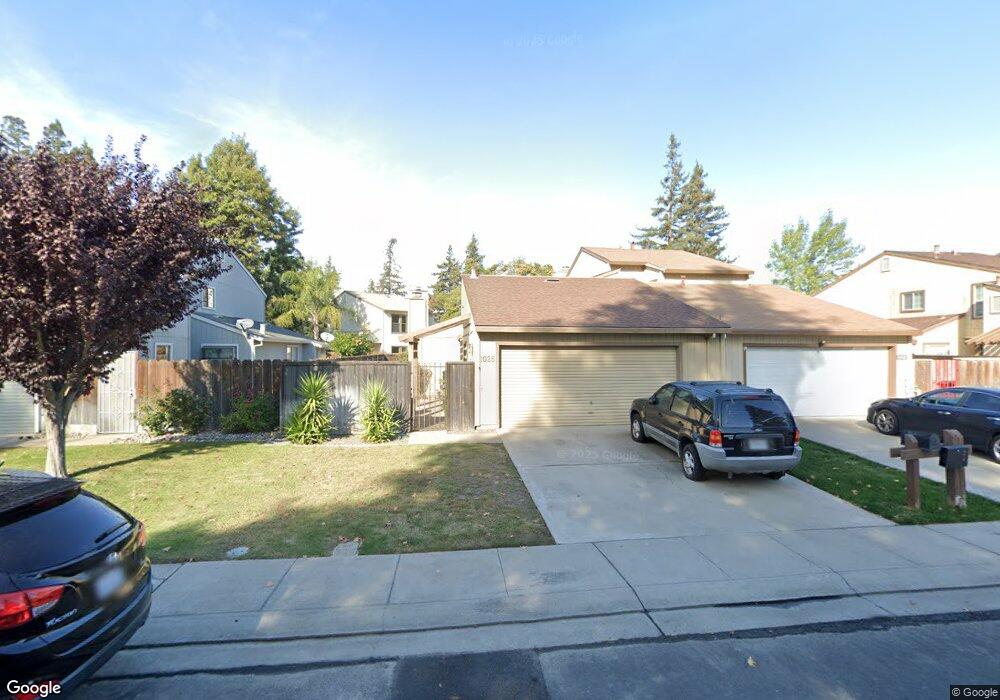
1025 Camphor St Manteca, CA 95337
Downtown Manteca NeighborhoodEstimated Value: $269,000 - $449,000
2
Beds
2
Baths
1,102
Sq Ft
$334/Sq Ft
Est. Value
About This Home
This home is located at 1025 Camphor St, Manteca, CA 95337 and is currently estimated at $368,054, approximately $333 per square foot. 1025 Camphor St is a home located in San Joaquin County with nearby schools including Stella Brockman Elementary School and Manteca High School.
Ownership History
Date
Name
Owned For
Owner Type
Purchase Details
Closed on
Aug 1, 2023
Sold by
Brown Lisa Ann
Bought by
J Kirk Brown And Lisa A Brown Family Revocabl and Brown
Current Estimated Value
Purchase Details
Closed on
May 11, 2023
Sold by
Bordenkircher Family Lp
Bought by
Dale E Bordenkircher And Donna R Bordenkirche
Purchase Details
Closed on
Jun 7, 2001
Sold by
Bordenkircher Dale E and Bordenkircher Donna R
Bought by
Bordenkircher Family Lp
Create a Home Valuation Report for This Property
The Home Valuation Report is an in-depth analysis detailing your home's value as well as a comparison with similar homes in the area
Home Values in the Area
Average Home Value in this Area
Purchase History
| Date | Buyer | Sale Price | Title Company |
|---|---|---|---|
| J Kirk Brown And Lisa A Brown Family Revocabl | -- | None Listed On Document | |
| Dale E Bordenkircher And Donna R Bordenkirche | -- | None Listed On Document | |
| Bordenkircher Family Lp | -- | -- |
Source: Public Records
Tax History
| Year | Tax Paid | Tax Assessment Tax Assessment Total Assessment is a certain percentage of the fair market value that is determined by local assessors to be the total taxable value of land and additions on the property. | Land | Improvement |
|---|---|---|---|---|
| 2025 | $1,992 | $178,020 | $75,574 | $102,446 |
| 2024 | $1,937 | $174,531 | $74,093 | $100,438 |
| 2023 | $1,912 | $171,110 | $72,641 | $98,469 |
| 2022 | $1,884 | $167,756 | $71,217 | $96,539 |
| 2021 | $1,864 | $164,468 | $69,821 | $94,647 |
| 2020 | $1,789 | $162,783 | $69,106 | $93,677 |
| 2019 | $1,766 | $159,592 | $67,751 | $91,841 |
| 2018 | $1,742 | $156,464 | $66,423 | $90,041 |
| 2017 | $1,717 | $153,397 | $65,121 | $88,276 |
| 2016 | $1,676 | $150,390 | $63,845 | $86,545 |
| 2015 | $1,666 | $148,131 | $62,886 | $85,245 |
| 2014 | -- | $145,229 | $61,654 | $83,575 |
Source: Public Records
Map
Nearby Homes
- 1023 Camphor St
- 414 Cherry Ln Unit G
- 495 Cherry Ln Unit B
- 495 Cherry Ln Unit G
- 480 Cherry Ln Unit E
- 427 Golf Cir W
- 1131 Meadowbrook Ct
- 290 Victory Ave
- 802 W Center St
- 119 Almond Ave
- 744 Wentworth Ave
- 811 Hacienda Ave
- 781 La Mesa Ct
- 848 Edythe St
- 449 Poplar Ave
- 846 Del Monte Ct
- 840 Del Monte Ct
- 885 Del Monte Ct
- 322 Poplar Ave
- 1073 Hacienda Ave
- 1035 Camphor St
- 1011 Camphor St
- 1037 Camphor St
- 1030 Cherry Ct
- 367 Cherry Ln
- 353 Cherry Ln
- 1047 Camphor St
- 1032 Cherry Ct
- 1028 Cherry Ct
- 369 Cherry Ln
- 1024 Camphor St
- 379 Cherry Ln
- 1049 Camphor St
- 1034 Camphor St
- 1022 Camphor St
- 1034 Cherry Ct
- 1010 Camphor St
- 1036 Camphor St
- 381 Cherry Ln
- 1046 Camphor St
Your Personal Tour Guide
Ask me questions while you tour the home.