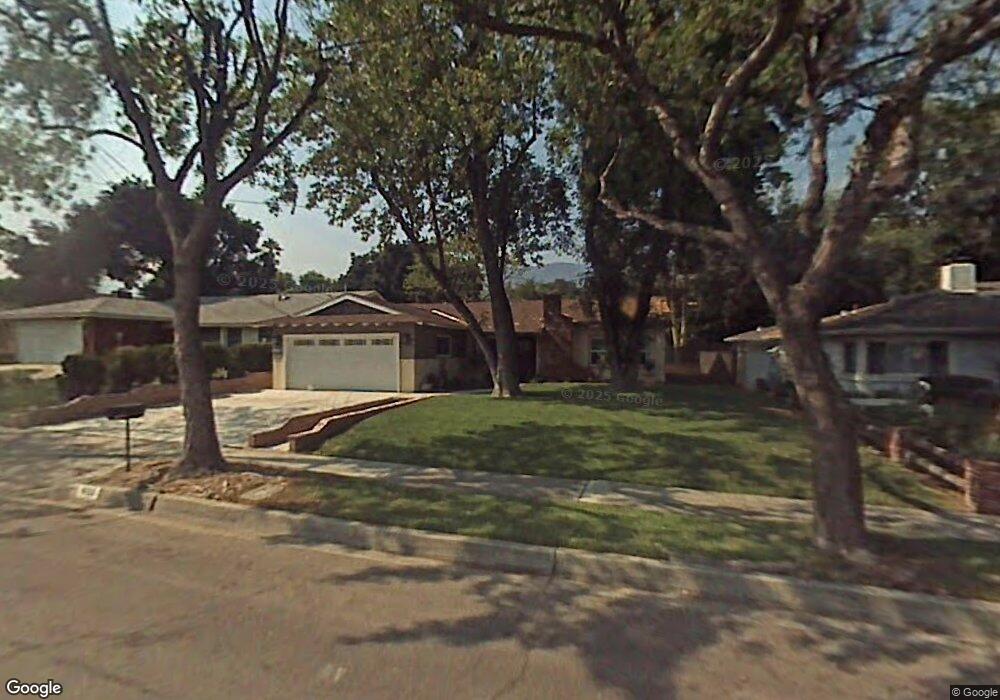
1025 Orange Ave Monrovia, CA 91016
Estimated Value: $965,153 - $1,204,000
3
Beds
2
Baths
1,600
Sq Ft
$675/Sq Ft
Est. Value
About This Home
This home is located at 1025 Orange Ave, Monrovia, CA 91016 and is currently estimated at $1,080,538, approximately $675 per square foot. 1025 Orange Ave is a home located in Los Angeles County with nearby schools including Bradoaks Elementary Science Academy, Clifton Middle School, and Monrovia High School.
Ownership History
Date
Name
Owned For
Owner Type
Purchase Details
Closed on
Jan 17, 2012
Sold by
Wong Peter Y
Bought by
Wong Peter Y K and Wong Camille Jo Ann
Current Estimated Value
Purchase Details
Closed on
Dec 15, 2011
Sold by
Aurora Loan Services Llc
Bought by
Wong Peter Y and Wong Camille J
Purchase Details
Closed on
Sep 21, 2011
Sold by
Thomas Jay V
Bought by
Aurora Loan Services Llc
Purchase Details
Closed on
Jan 24, 2011
Sold by
Thomas Jay V
Bought by
Wade Rona
Purchase Details
Closed on
Nov 30, 2010
Sold by
Thomas Jay V
Bought by
West David
Purchase Details
Closed on
May 6, 2005
Sold by
Valco Donald J
Bought by
Thomas Jay V and Thomas Jennifer C
Home Financials for this Owner
Home Financials are based on the most recent Mortgage that was taken out on this home.
Original Mortgage
$428,000
Interest Rate
5.87%
Mortgage Type
Purchase Money Mortgage
Purchase Details
Closed on
Jan 11, 1999
Sold by
Valco Donald J
Bought by
Valco Donald J and Donald J Valco Trust
Create a Home Valuation Report for This Property
The Home Valuation Report is an in-depth analysis detailing your home's value as well as a comparison with similar homes in the area
Home Values in the Area
Average Home Value in this Area
Purchase History
| Date | Buyer | Sale Price | Title Company |
|---|---|---|---|
| Wong Peter Y K | -- | Accommodation | |
| Wong Peter Y | $471,000 | Lsi Title Company | |
| Aurora Loan Services Llc | $465,089 | None Available | |
| Wade Rona | -- | None Available | |
| West David | -- | None Available | |
| Thomas Jay V | $535,000 | Ticor Title Co Glendale | |
| Valco Donald J | -- | -- |
Source: Public Records
Mortgage History
| Date | Status | Borrower | Loan Amount |
|---|---|---|---|
| Previous Owner | Thomas Jay V | $428,000 | |
| Closed | Thomas Jay V | $53,500 |
Source: Public Records
Tax History
| Year | Tax Paid | Tax Assessment Tax Assessment Total Assessment is a certain percentage of the fair market value that is determined by local assessors to be the total taxable value of land and additions on the property. | Land | Improvement |
|---|---|---|---|---|
| 2025 | $7,939 | $591,590 | $309,360 | $282,230 |
| 2024 | $7,939 | $579,992 | $303,295 | $276,697 |
| 2023 | $7,756 | $568,621 | $297,349 | $271,272 |
| 2022 | $7,530 | $557,472 | $291,519 | $265,953 |
| 2021 | $7,379 | $546,542 | $285,803 | $260,739 |
| 2019 | $7,027 | $530,333 | $277,327 | $253,006 |
| 2018 | $6,849 | $519,936 | $271,890 | $248,046 |
| 2016 | $6,580 | $499,748 | $261,333 | $238,415 |
| 2015 | $6,435 | $492,242 | $257,408 | $234,834 |
| 2014 | $6,368 | $482,600 | $252,366 | $230,234 |
Source: Public Records
Map
Nearby Homes
- 1120 Sesmas St
- 938 Huntington Dr Unit K
- 820 Junipero Dr
- 1367 3rd St
- 165 Circle Dr
- 188 Deodar Ln
- 108 S Mountain Ave Unit A
- 526 E Olive Ave Unit A
- 201 Deodar Ln
- 835 E Foothill Blvd
- 61 Palm Hill Ln
- 930 Ocean View Ave Unit E
- 520 E Lime Ave
- 115 N Mountain Ave Unit A
- 136 Madeline Dr
- 824 Ocean View Ave
- 415 E Walnut Ave
- 418 E Olive Ave
- 100 Palm Hill Ln
- 401 E Cherry Ave
- 1029 Orange Ave
- 1021 Orange Ave
- 1017 Orange Ave
- 1024 Orange Ave
- 1028 Orange Ave
- 1020 Orange Ave
- 629 Bradbury Rd
- 619 Bradbury Rd
- 1013 Orange Ave
- 1032 Orange Ave
- 1016 Orange Ave
- 615 Bradbury Rd
- 1036 Orange Ave
- 1012 Orange Ave
- 1009 Orange Ave
- 1029 Royal Oaks Dr
- 1033 Royal Oaks Dr
- 1025 Royal Oaks Dr
- 600 Parkrose Ave
- 1037 Royal Oaks Dr
Your Personal Tour Guide
Ask me questions while you tour the home.