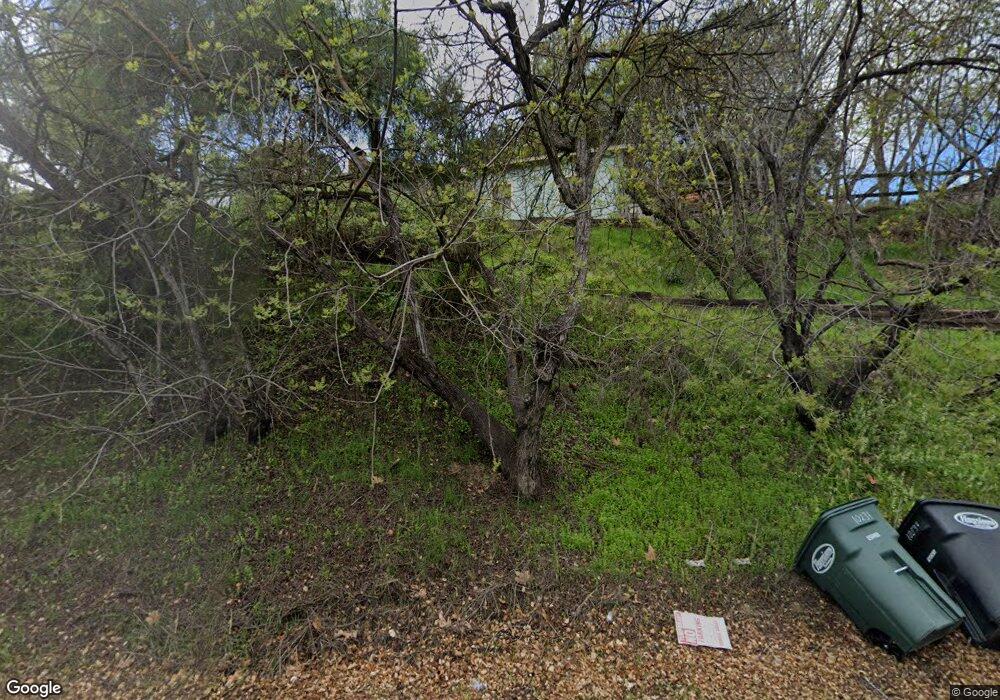
10265 Creek Rd Oak View, CA 93022
Estimated Value: $777,150 - $910,000
2
Beds
1
Bath
1,230
Sq Ft
$685/Sq Ft
Est. Value
About This Home
This home is located at 10265 Creek Rd, Oak View, CA 93022 and is currently estimated at $843,038, approximately $685 per square foot. 10265 Creek Rd is a home located in Ventura County with nearby schools including Sunset Elementary School, De Anza Academy Of Technology And The Arts, and Ventura High School.
Ownership History
Date
Name
Owned For
Owner Type
Purchase Details
Closed on
Apr 23, 1998
Sold by
Liza Briem and Breim West Kristena
Bought by
Roper D E
Current Estimated Value
Home Financials for this Owner
Home Financials are based on the most recent Mortgage that was taken out on this home.
Original Mortgage
$147,250
Outstanding Balance
$28,026
Interest Rate
7.13%
Estimated Equity
$815,012
Purchase Details
Closed on
Apr 20, 1998
Sold by
Ameeti Patricia H
Bought by
Roper D E
Home Financials for this Owner
Home Financials are based on the most recent Mortgage that was taken out on this home.
Original Mortgage
$147,250
Outstanding Balance
$28,026
Interest Rate
7.13%
Estimated Equity
$815,012
Purchase Details
Closed on
Nov 9, 1995
Sold by
Briem Liza and West Kristena Briem
Bought by
Briem Liza and West Kristena Briem
Purchase Details
Closed on
Mar 2, 1995
Sold by
Mcneel Margie M
Bought by
Mcneel Margie M and Briem Liza
Create a Home Valuation Report for This Property
The Home Valuation Report is an in-depth analysis detailing your home's value as well as a comparison with similar homes in the area
Home Values in the Area
Average Home Value in this Area
Purchase History
| Date | Buyer | Sale Price | Title Company |
|---|---|---|---|
| Roper D E | $155,000 | First American Title Ins Co | |
| Roper D E | -- | First American Title Ins Co | |
| Briem Liza | -- | Gateway Title Company | |
| Mcneel Margie M | -- | -- |
Source: Public Records
Mortgage History
| Date | Status | Borrower | Loan Amount |
|---|---|---|---|
| Open | Roper D E | $147,250 |
Source: Public Records
Tax History Compared to Growth
Tax History
| Year | Tax Paid | Tax Assessment Tax Assessment Total Assessment is a certain percentage of the fair market value that is determined by local assessors to be the total taxable value of land and additions on the property. | Land | Improvement |
|---|---|---|---|---|
| 2025 | $2,741 | $247,453 | $175,624 | $71,829 |
| 2024 | $2,741 | $242,601 | $172,180 | $70,421 |
| 2023 | $2,706 | $237,845 | $168,804 | $69,041 |
| 2022 | $2,525 | $233,182 | $165,494 | $67,688 |
| 2021 | $2,475 | $228,610 | $162,249 | $66,361 |
| 2020 | $2,450 | $226,269 | $160,587 | $65,682 |
| 2019 | $2,403 | $221,834 | $157,439 | $64,395 |
| 2018 | $2,362 | $217,485 | $154,352 | $63,133 |
| 2017 | $2,311 | $213,222 | $151,326 | $61,896 |
| 2016 | $2,265 | $209,042 | $148,359 | $60,683 |
| 2015 | $2,240 | $205,904 | $146,132 | $59,772 |
| 2014 | $2,218 | $201,872 | $143,270 | $58,602 |
Source: Public Records
Map
Nearby Homes
- 10461 N Dale Ave
- 40 Almond Ave
- 150 N Donna St
- 110 E Oak View Ave
- 240 Portal St
- 10480 Creek Rd
- 228 High St
- 10484 Creek Rd
- 10562 Creek Rd
- 291 Larmier Ave
- 587 Vine St
- 317 Prospect St
- 53 Prospect St
- 0 Encino Dr Unit 25-330
- 0 Encino Dr Unit 224457
- 0 Encino Dr Unit V1-27708
- 10920 Ventura Ave
- 10945 Alto Ct
- 250 Verde Oak Dr
- 10257 Creek Rd
- 10343 Creek Rd
- 10343 Creek Rd
- 10167 Creek Rd
- 10345 Creek Rd
- 10345 Creek Rd
- 10185 Creek Rd
- 10165 Creek Rd
- 10351 Creek Rd
- 10347 Creek Rd
- 10157 Creek Rd
- 10180 Creek Rd
- 310 E Oak View Ave
- 10156 Creek Rd
- 10348 Creek Rd
- 10355 Creek Rd
- 300 E Oak View Ave
- 10139 Creek Rd
- 270 274 E Oak View Ave
- 270 E Oak View Ave