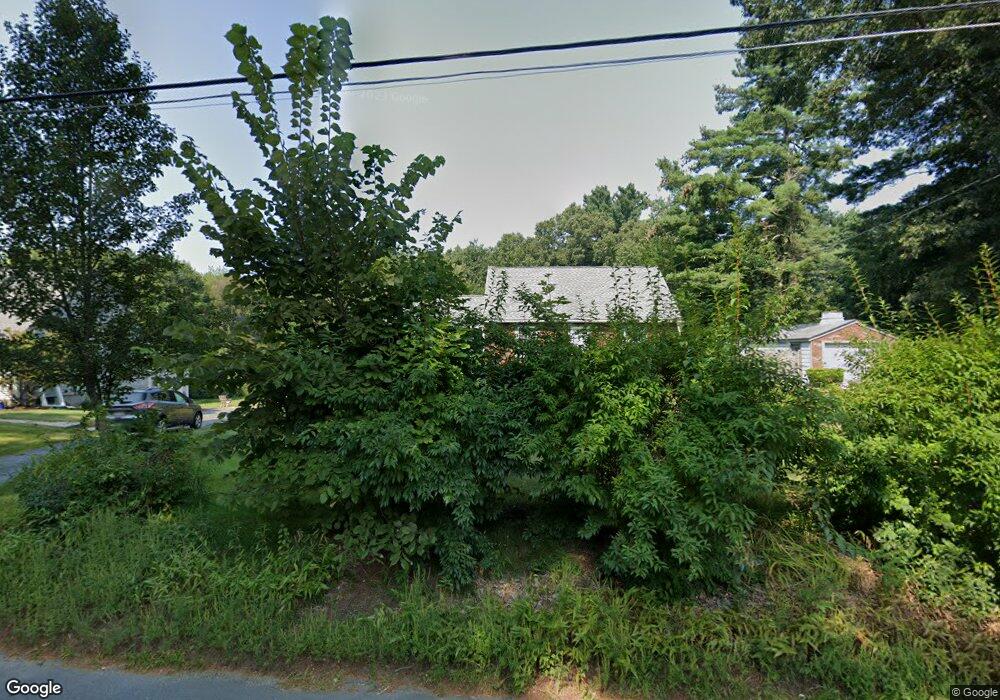
103 Pine St Franklin, MA 02038
Estimated Value: $493,212 - $533,000
4
Beds
1
Bath
1,215
Sq Ft
$424/Sq Ft
Est. Value
About This Home
This home is located at 103 Pine St, Franklin, MA 02038 and is currently estimated at $514,803, approximately $423 per square foot. 103 Pine St is a home located in Norfolk County with nearby schools including John F. Kennedy Memorial School, Horace Mann Middle School, and Franklin High School.
Ownership History
Date
Name
Owned For
Owner Type
Purchase Details
Closed on
Feb 5, 2024
Sold by
Padula Peter F
Bought by
103 Pine St Rt and Padula
Current Estimated Value
Purchase Details
Closed on
Feb 6, 2023
Sold by
Sullivan Robert F Est and Pizzi
Bought by
Padula Peter F
Home Financials for this Owner
Home Financials are based on the most recent Mortgage that was taken out on this home.
Original Mortgage
$294,500
Interest Rate
6.27%
Mortgage Type
Purchase Money Mortgage
Purchase Details
Closed on
Jul 30, 2010
Sold by
Sullivan Marie F and Sullivan Robert F
Bought by
Sullivan Robert F
Create a Home Valuation Report for This Property
The Home Valuation Report is an in-depth analysis detailing your home's value as well as a comparison with similar homes in the area
Purchase History
| Date | Buyer | Sale Price | Title Company |
|---|---|---|---|
| 103 Pine St Rt | -- | None Available | |
| Padula Peter F | $310,000 | None Available | |
| Sullivan Robert F | -- | -- | |
| Sullivan Robert F | -- | -- |
Source: Public Records
Mortgage History
| Date | Status | Borrower | Loan Amount |
|---|---|---|---|
| Previous Owner | Padula Peter F | $294,500 | |
| Previous Owner | Sullivan Robert F | $330,000 |
Source: Public Records
Tax History
| Year | Tax Paid | Tax Assessment Tax Assessment Total Assessment is a certain percentage of the fair market value that is determined by local assessors to be the total taxable value of land and additions on the property. | Land | Improvement |
|---|---|---|---|---|
| 2025 | $5,744 | $494,300 | $330,200 | $164,100 |
| 2024 | $5,656 | $479,700 | $330,200 | $149,500 |
| 2023 | $5,430 | $431,600 | $286,700 | $144,900 |
| 2022 | $4,846 | $344,900 | $217,200 | $127,700 |
| 2021 | $4,911 | $335,200 | $241,400 | $93,800 |
| 2020 | $4,566 | $314,700 | $225,500 | $89,200 |
| 2019 | $4,496 | $306,700 | $217,500 | $89,200 |
| 2018 | $4,300 | $293,500 | $213,500 | $80,000 |
| 2017 | $4,075 | $279,500 | $199,500 | $80,000 |
| 2016 | $3,916 | $270,100 | $202,200 | $67,900 |
| 2015 | $3,931 | $264,900 | $197,000 | $67,900 |
| 2014 | $3,478 | $240,700 | $172,800 | $67,900 |
Source: Public Records
Map
Nearby Homes
Your Personal Tour Guide
Ask me questions while you tour the home.