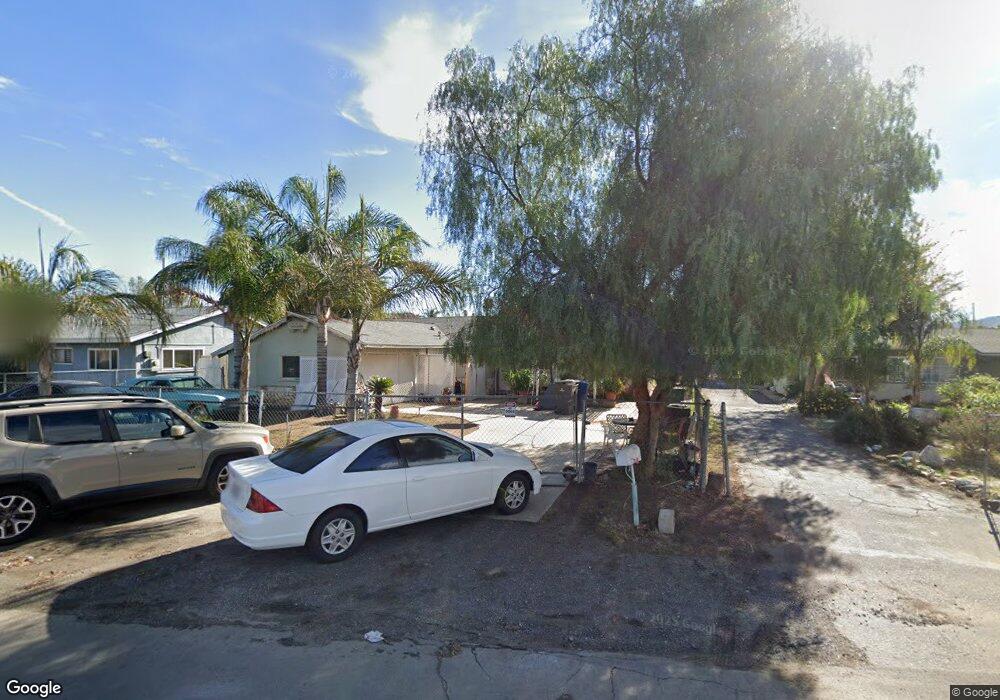
10342 Mull Ave Riverside, CA 92505
La Sierra NeighborhoodEstimated Value: $561,000 - $620,455
3
Beds
2
Baths
1,380
Sq Ft
$428/Sq Ft
Est. Value
About This Home
This home is located at 10342 Mull Ave, Riverside, CA 92505 and is currently estimated at $590,864, approximately $428 per square foot. 10342 Mull Ave is a home located in Riverside County with nearby schools including Myra Linn Elementary School, Arizona Middle School, and La Sierra High School.
Ownership History
Date
Name
Owned For
Owner Type
Purchase Details
Closed on
Mar 2, 2009
Sold by
Us Bank National Association
Bought by
Trejo Jose Humberto Mora
Current Estimated Value
Home Financials for this Owner
Home Financials are based on the most recent Mortgage that was taken out on this home.
Original Mortgage
$128,306
Outstanding Balance
$81,369
Interest Rate
5.08%
Mortgage Type
FHA
Estimated Equity
$509,495
Purchase Details
Closed on
Aug 29, 2008
Sold by
Morales Geronimo Rodriguez
Bought by
U S Bank Na and The Structured Asset Securities Corp Mor
Purchase Details
Closed on
Mar 2, 2006
Sold by
Goucher Stina
Bought by
Morales Geronimo Rodriguez
Home Financials for this Owner
Home Financials are based on the most recent Mortgage that was taken out on this home.
Original Mortgage
$313,600
Interest Rate
7.3%
Mortgage Type
Balloon
Purchase Details
Closed on
Nov 22, 1999
Sold by
Hewitt Walter C and Hewitt Margaret E
Bought by
Hewitt Walter C and Hewitt Margaret E
Create a Home Valuation Report for This Property
The Home Valuation Report is an in-depth analysis detailing your home's value as well as a comparison with similar homes in the area
Home Values in the Area
Average Home Value in this Area
Purchase History
| Date | Buyer | Sale Price | Title Company |
|---|---|---|---|
| Trejo Jose Humberto Mora | $130,000 | California Title Company | |
| U S Bank Na | $159,250 | Accommodation | |
| Morales Geronimo Rodriguez | $392,000 | Commonwealth Land Title Co | |
| Hewitt Walter C | -- | -- |
Source: Public Records
Mortgage History
| Date | Status | Borrower | Loan Amount |
|---|---|---|---|
| Open | Trejo Jose Humberto Mora | $128,306 | |
| Previous Owner | Morales Geronimo Rodriguez | $313,600 |
Source: Public Records
Tax History
| Year | Tax Paid | Tax Assessment Tax Assessment Total Assessment is a certain percentage of the fair market value that is determined by local assessors to be the total taxable value of land and additions on the property. | Land | Improvement |
|---|---|---|---|---|
| 2025 | $2,050 | $167,387 | $90,134 | $77,253 |
| 2023 | $2,050 | $160,889 | $86,635 | $74,254 |
| 2022 | $1,899 | $157,736 | $84,937 | $72,799 |
| 2021 | $1,879 | $154,644 | $83,272 | $71,372 |
| 2020 | $1,850 | $153,060 | $82,419 | $70,641 |
| 2019 | $1,827 | $150,059 | $80,803 | $69,256 |
| 2018 | $1,802 | $147,118 | $79,219 | $67,899 |
| 2017 | $1,769 | $144,234 | $77,666 | $66,568 |
| 2016 | $1,741 | $141,407 | $76,144 | $65,263 |
| 2015 | $1,715 | $139,285 | $75,001 | $64,284 |
| 2014 | $1,709 | $136,559 | $73,533 | $63,026 |
Source: Public Records
Map
Nearby Homes
- 4615 Mobley Ave
- 4979 Tyler Meadow Rd
- 10520 Cook Ave
- 0 Cook Ave Unit PW25235031
- 5130 Hedrick Ave
- 4834 Hedrick Ave
- 10710 Brookfield Dr
- 10233 Clara Vista Ln
- 4314 Baggett Dr
- 10450 Gramercy Place
- 5347 Crest Ave
- 5382 Crest Ave
- 10514 Cameo Ct
- 4998 Bushnell Ave
- 5300 Noble St
- 0 Sunnyslope Ave
- 10881 Sunnyslope Dr Unit 2
- 3946 Tomlinson Ave
- 5642 Babb Ave
- 5651 Babb Ave
Your Personal Tour Guide
Ask me questions while you tour the home.