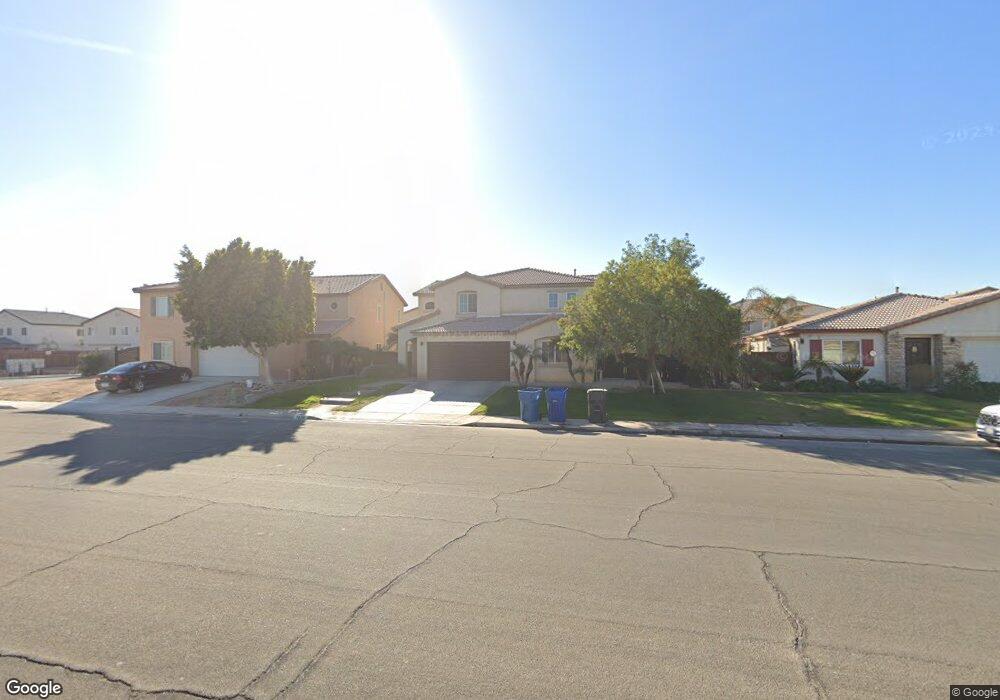
1036 Spud Moreno St Calexico, CA 92231
Estimated Value: $467,855 - $527,000
6
Beds
3
Baths
2,348
Sq Ft
$213/Sq Ft
Est. Value
About This Home
This home is located at 1036 Spud Moreno St, Calexico, CA 92231 and is currently estimated at $500,714, approximately $213 per square foot. 1036 Spud Moreno St is a home located in Imperial County with nearby schools including Kennedy Gardens Elementary School, William Moreno Junior High School, and Calexico High School.
Ownership History
Date
Name
Owned For
Owner Type
Purchase Details
Closed on
Feb 26, 2019
Sold by
Villegas Emilio
Bought by
Saenz Yadira
Current Estimated Value
Purchase Details
Closed on
Feb 19, 2010
Sold by
Liquidation Properties Inc
Bought by
Garcia Emilio Villegas
Purchase Details
Closed on
Jun 18, 2009
Sold by
Zamarripa Juan A
Bought by
Liquidation Properties Inc
Purchase Details
Closed on
Dec 6, 2006
Sold by
Zamarripa Martha D
Bought by
Zamarripa Juan A
Home Financials for this Owner
Home Financials are based on the most recent Mortgage that was taken out on this home.
Original Mortgage
$284,700
Interest Rate
6.12%
Mortgage Type
Purchase Money Mortgage
Purchase Details
Closed on
Nov 14, 2006
Sold by
Pcc La Jolla Palms Llc
Bought by
Zamarripa Juan A
Home Financials for this Owner
Home Financials are based on the most recent Mortgage that was taken out on this home.
Original Mortgage
$284,700
Interest Rate
6.12%
Mortgage Type
Purchase Money Mortgage
Create a Home Valuation Report for This Property
The Home Valuation Report is an in-depth analysis detailing your home's value as well as a comparison with similar homes in the area
Home Values in the Area
Average Home Value in this Area
Purchase History
| Date | Buyer | Sale Price | Title Company |
|---|---|---|---|
| Saenz Yadira | -- | None Available | |
| Garcia Emilio Villegas | $170,000 | Multiple | |
| Liquidation Properties Inc | $144,500 | None Available | |
| Zamarripa Juan A | -- | Landamerica Title Company | |
| Zamarripa Juan A | $356,000 | Landamerica Title Company |
Source: Public Records
Mortgage History
| Date | Status | Borrower | Loan Amount |
|---|---|---|---|
| Previous Owner | Zamarripa Juan A | $284,700 |
Source: Public Records
Tax History Compared to Growth
Tax History
| Year | Tax Paid | Tax Assessment Tax Assessment Total Assessment is a certain percentage of the fair market value that is determined by local assessors to be the total taxable value of land and additions on the property. | Land | Improvement |
|---|---|---|---|---|
| 2025 | $5,722 | $292,262 | $55,774 | $236,488 |
| 2023 | $5,722 | $280,914 | $53,609 | $227,305 |
| 2022 | $6,217 | $275,407 | $52,558 | $222,849 |
| 2021 | $6,084 | $270,008 | $51,528 | $218,480 |
| 2020 | $5,952 | $267,240 | $51,000 | $216,240 |
| 2019 | $5,042 | $190,806 | $46,283 | $144,523 |
| 2018 | $5,008 | $187,066 | $45,376 | $141,690 |
| 2017 | $4,845 | $183,399 | $44,487 | $138,912 |
| 2016 | $4,749 | $179,804 | $43,615 | $136,189 |
| 2015 | $4,723 | $177,104 | $42,960 | $134,144 |
| 2014 | $4,670 | $173,636 | $42,119 | $131,517 |
Source: Public Records
Map
Nearby Homes
- 1000 E Cole Rd
- 0 E Cole Rd Unit Lot 1 250029524
- 2117 Descanso Dr
- 950 Santa Ana St
- 1900 Rancho Frontera Ave Unit H59
- 952 Alameda St
- 2186 G Woo Ave
- 1336 Albright St
- 105 John Kennedy St
- 1252 Fiesta Ave
- 1268 Topaz Ct
- 1245 C N Perry Rd
- 0 Avenida de Oro
- 101 Vernardo Dr Unit 71
- 1119 Imperial Ave W
- 711 N Preston Dr
- 0 California 98
- 1 Towncenter Blvd & Sunset Blvd Blvd
- 0 Towncenter Blvd & Sunset Blvd Unit 1 250029404
- 900 Paseo de Alteza St
- 1032 Spud Moreno St
- 1040 Spud Moreno St
- 1031 F Torres St
- 1035 F Torres St
- 1029 F Torres St
- 1028 Spud Moreno St
- 1025 F Torres St
- 1024 Spud Moreno St
- 1031 Spud Moreno St
- 1035 Spud Moreno St
- 1045 0 F Torres St
- 1045 F Torres St
- 1021 F Torres St
- 1029 Spud Moreno St
- 1018 Spud Moreno St
- 1025 Spud Moreno St
- 2476 A Zuniga Ct
- 2475 G Figueroa Ave
- 1017 F Torres St
- 1049 F Torres St