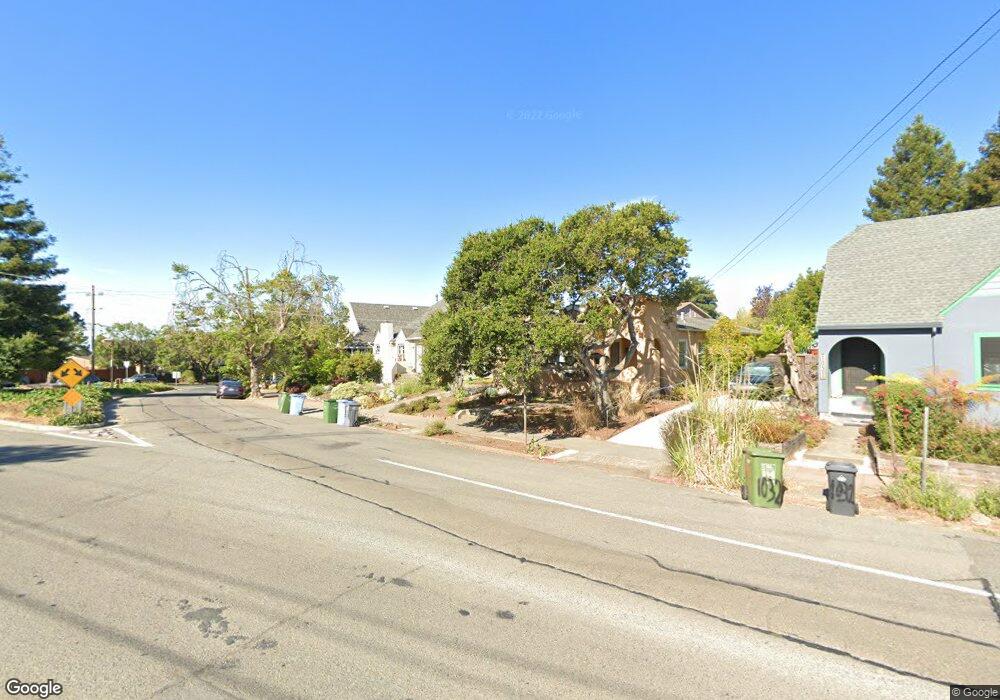
1040 Colusa Ave Berkeley, CA 94707
Northbrae NeighborhoodEstimated Value: $1,282,000 - $1,827,000
2
Beds
1
Bath
1,182
Sq Ft
$1,268/Sq Ft
Est. Value
About This Home
This home is located at 1040 Colusa Ave, Berkeley, CA 94707 and is currently estimated at $1,499,082, approximately $1,268 per square foot. 1040 Colusa Ave is a home located in Alameda County with nearby schools including Thousand Oaks Elementary School, Ruth Acty Elementary, and Berkeley Arts Magnet at Whittier School.
Ownership History
Date
Name
Owned For
Owner Type
Purchase Details
Closed on
May 14, 2013
Sold by
Thiebaud James and Thiebaud Lynn
Bought by
Thiebaud James and Thiebaud Lynn
Current Estimated Value
Purchase Details
Closed on
Mar 21, 2007
Sold by
Slusser George E and Slusser Danielle C
Bought by
Thiebaud James and Thiebaud Lynn
Home Financials for this Owner
Home Financials are based on the most recent Mortgage that was taken out on this home.
Original Mortgage
$640,000
Outstanding Balance
$388,019
Interest Rate
6.29%
Mortgage Type
Purchase Money Mortgage
Estimated Equity
$1,111,063
Purchase Details
Closed on
Jan 31, 2003
Sold by
Slusser George E and Slusser Daniele C
Bought by
Slusser George E and Slusser Daniele C
Purchase Details
Closed on
Dec 16, 1988
Sold by
Slusser Raymond L and Will Of Edlo K Slusser
Bought by
Slusser George
Create a Home Valuation Report for This Property
The Home Valuation Report is an in-depth analysis detailing your home's value as well as a comparison with similar homes in the area
Home Values in the Area
Average Home Value in this Area
Purchase History
| Date | Buyer | Sale Price | Title Company |
|---|---|---|---|
| Thiebaud James | -- | None Available | |
| Thiebaud James | $800,000 | Old Republic Title Company | |
| Slusser George E | -- | -- | |
| Slusser George E | -- | -- | |
| Slusser George | -- | -- |
Source: Public Records
Mortgage History
| Date | Status | Borrower | Loan Amount |
|---|---|---|---|
| Open | Thiebaud James | $640,000 |
Source: Public Records
Tax History
| Year | Tax Paid | Tax Assessment Tax Assessment Total Assessment is a certain percentage of the fair market value that is determined by local assessors to be the total taxable value of land and additions on the property. | Land | Improvement |
|---|---|---|---|---|
| 2025 | $15,038 | $1,064,743 | $321,523 | $750,220 |
| 2024 | $15,038 | $1,043,735 | $315,220 | $735,515 |
| 2023 | $14,735 | $1,030,135 | $309,040 | $721,095 |
| 2022 | $14,501 | $1,002,943 | $302,983 | $706,960 |
| 2021 | $14,554 | $983,143 | $297,043 | $693,100 |
| 2020 | $13,864 | $979,991 | $293,997 | $685,994 |
| 2019 | $13,417 | $960,783 | $288,235 | $672,548 |
| 2018 | $13,210 | $941,951 | $282,585 | $659,366 |
| 2017 | $12,752 | $923,487 | $277,046 | $646,441 |
| 2016 | $12,409 | $905,383 | $271,615 | $633,768 |
| 2015 | $12,252 | $891,791 | $267,537 | $624,254 |
| 2014 | $10,719 | $760,000 | $228,000 | $532,000 |
Source: Public Records
Map
Nearby Homes
- 1626 Hopkins St
- 1950 Hopkins St
- 1498 Sonoma Ave
- 1858 San Lorenzo Ave
- 1425 Martin Luther King jr Way
- 1036 Ramona Ave
- 1841 Vine St
- 753 Peralta Ave
- 1120 Curtis St
- 2121 Eunice St
- 1408 Henry St
- 1983 Yosemite Rd
- 1127 Key Route Blvd
- 731 Santa fe Ave
- 1329 Ordway St
- 813 San Diego Rd
- 938 San Benito Rd
- 765 San Diego Rd
- 1444 Walnut St
- 1609 Bonita Ave Unit 5
- 1044 Monterey Ave
- 1036 Colusa Ave
- 1048 Monterey Ave
- 1032 Colusa Ave
- 1052 Monterey Ave
- 1031 Merced St
- 1030 Colusa Ave
- 1039 Merced St
- 1027 Merced St
- 1041 Merced St
- 1056 Monterey Ave
- 1023 Merced St
- 1026 Colusa Ave
- 1801 Monterey Ave
- 1043 Merced St
- 1019 Merced St
- 1037 Colusa Ave
- 1060 Monterey Ave
- 1805 Monterey Ave
- 1024 Colusa Ave
Your Personal Tour Guide
Ask me questions while you tour the home.