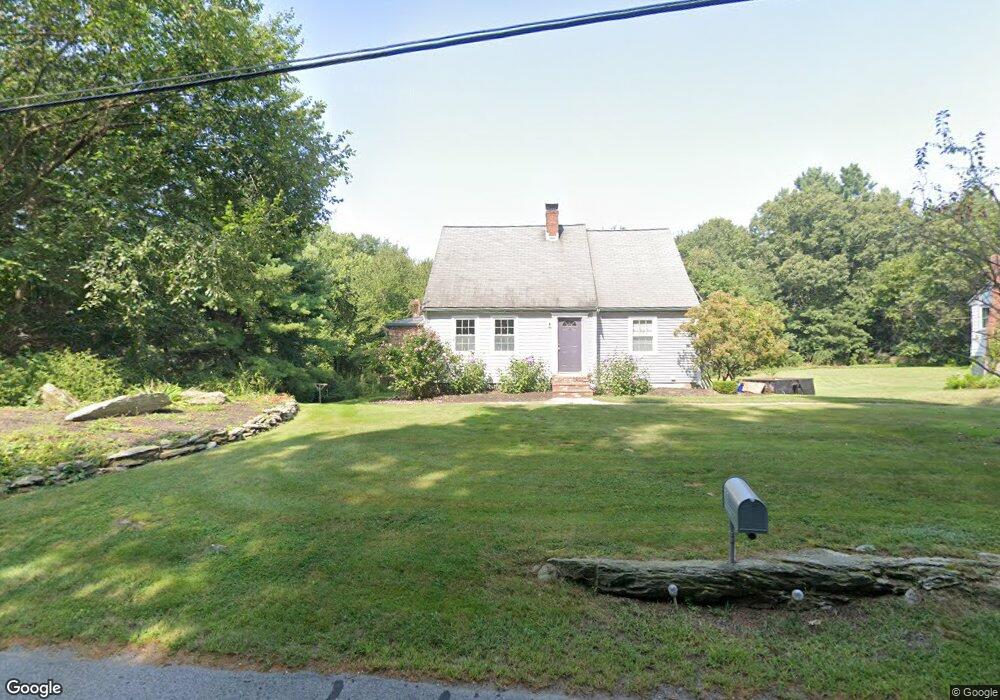
105 Pine St Franklin, MA 02038
Estimated Value: $658,000 - $941,000
4
Beds
2
Baths
1,900
Sq Ft
$415/Sq Ft
Est. Value
About This Home
This home is located at 105 Pine St, Franklin, MA 02038 and is currently estimated at $788,874, approximately $415 per square foot. 105 Pine St is a home located in Norfolk County with nearby schools including John F. Kennedy Memorial School, Horace Mann Middle School, and Franklin High School.
Ownership History
Date
Name
Owned For
Owner Type
Purchase Details
Closed on
Aug 26, 2011
Sold by
Genet Jennifer L and Lynch Lorna E
Bought by
Maclean Donald L and Maclean Lyn M
Current Estimated Value
Home Financials for this Owner
Home Financials are based on the most recent Mortgage that was taken out on this home.
Original Mortgage
$334,400
Outstanding Balance
$231,927
Interest Rate
4.53%
Mortgage Type
Purchase Money Mortgage
Estimated Equity
$556,947
Purchase Details
Closed on
Sep 1, 1995
Sold by
Mcalister Gary B and Mcalister Susan R
Bought by
Genet Jennifer L
Create a Home Valuation Report for This Property
The Home Valuation Report is an in-depth analysis detailing your home's value as well as a comparison with similar homes in the area
Purchase History
| Date | Buyer | Sale Price | Title Company |
|---|---|---|---|
| Maclean Donald L | $352,000 | -- | |
| Genet Jennifer L | $160,500 | -- |
Source: Public Records
Mortgage History
| Date | Status | Borrower | Loan Amount |
|---|---|---|---|
| Open | Maclean Donald L | $334,400 | |
| Previous Owner | Genet Jennifer L | $40,000 | |
| Previous Owner | Genet Jennifer L | $212,000 | |
| Previous Owner | Genet Jennifer L | $150,000 |
Source: Public Records
Tax History
| Year | Tax Paid | Tax Assessment Tax Assessment Total Assessment is a certain percentage of the fair market value that is determined by local assessors to be the total taxable value of land and additions on the property. | Land | Improvement |
|---|---|---|---|---|
| 2025 | $7,910 | $680,700 | $332,100 | $348,600 |
| 2024 | $7,653 | $649,100 | $332,100 | $317,000 |
| 2023 | $7,620 | $605,700 | $288,400 | $317,300 |
| 2022 | $6,970 | $496,100 | $218,500 | $277,600 |
| 2021 | $6,814 | $465,100 | $242,900 | $222,200 |
| 2020 | $6,357 | $438,100 | $226,800 | $211,300 |
| 2019 | $6,302 | $429,900 | $218,800 | $211,100 |
| 2018 | $5,922 | $404,200 | $214,800 | $189,400 |
| 2017 | $5,594 | $383,700 | $200,700 | $183,000 |
| 2016 | $5,314 | $366,500 | $203,400 | $163,100 |
| 2015 | $5,360 | $361,200 | $198,100 | $163,100 |
| 2014 | $4,868 | $336,900 | $173,800 | $163,100 |
Source: Public Records
Map
Nearby Homes
Your Personal Tour Guide
Ask me questions while you tour the home.