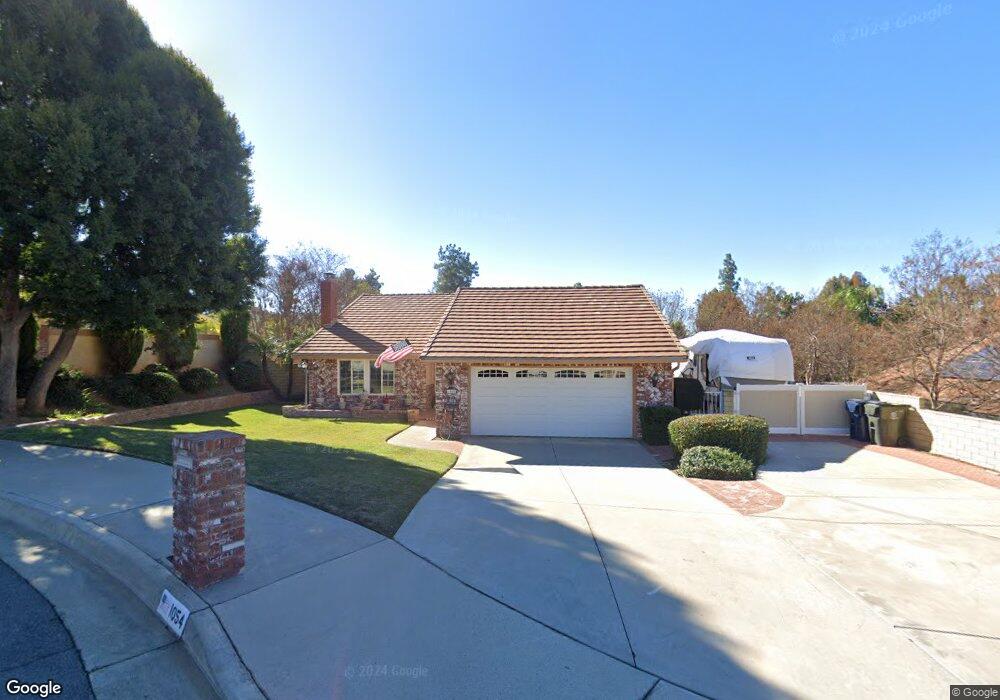
1054 Everron Ct Redlands, CA 92374
South Redlands NeighborhoodEstimated Value: $628,382 - $700,000
3
Beds
2
Baths
1,718
Sq Ft
$390/Sq Ft
Est. Value
About This Home
This home is located at 1054 Everron Ct, Redlands, CA 92374 and is currently estimated at $670,096, approximately $390 per square foot. 1054 Everron Ct is a home located in San Bernardino County with nearby schools including Kimberly Elementary School, Moore Middle School, and Redlands Senior High School.
Ownership History
Date
Name
Owned For
Owner Type
Purchase Details
Closed on
Jun 15, 2006
Sold by
Simpson Thomas B and Simpson Linda S
Bought by
Simpson Trust
Current Estimated Value
Purchase Details
Closed on
Oct 11, 2001
Sold by
Larson Jack D and Larson Sandra C
Bought by
Simpson Thomas B and Simpson Linda S
Home Financials for this Owner
Home Financials are based on the most recent Mortgage that was taken out on this home.
Original Mortgage
$157,000
Interest Rate
6.84%
Purchase Details
Closed on
Mar 16, 2001
Sold by
Larson Jack D
Bought by
Larson Jack D and Larson Sandra C
Purchase Details
Closed on
Sep 27, 1995
Sold by
Krill Dangermond E Scott and Krill Dangermond Karen
Bought by
Larson Jack D
Home Financials for this Owner
Home Financials are based on the most recent Mortgage that was taken out on this home.
Original Mortgage
$112,400
Interest Rate
7.67%
Create a Home Valuation Report for This Property
The Home Valuation Report is an in-depth analysis detailing your home's value as well as a comparison with similar homes in the area
Home Values in the Area
Average Home Value in this Area
Purchase History
| Date | Buyer | Sale Price | Title Company |
|---|---|---|---|
| Simpson Trust | -- | None Available | |
| Simpson Thomas B | $197,000 | Chicago Title Co | |
| Larson Jack D | -- | -- | |
| Larson Jack D | $125,000 | Chicago Title Co |
Source: Public Records
Mortgage History
| Date | Status | Borrower | Loan Amount |
|---|---|---|---|
| Closed | Simpson Thomas B | $157,000 | |
| Previous Owner | Larson Jack D | $112,400 |
Source: Public Records
Tax History
| Year | Tax Paid | Tax Assessment Tax Assessment Total Assessment is a certain percentage of the fair market value that is determined by local assessors to be the total taxable value of land and additions on the property. | Land | Improvement |
|---|---|---|---|---|
| 2025 | $3,973 | $325,195 | $72,757 | $252,438 |
| 2024 | $3,709 | $318,818 | $71,330 | $247,488 |
| 2023 | $3,703 | $312,566 | $69,931 | $242,635 |
| 2022 | $3,648 | $306,437 | $68,560 | $237,877 |
| 2021 | $3,712 | $300,429 | $67,216 | $233,213 |
| 2020 | $3,656 | $297,349 | $66,527 | $230,822 |
| 2019 | $3,553 | $291,519 | $65,223 | $226,296 |
| 2018 | $3,463 | $285,803 | $63,944 | $221,859 |
| 2017 | $3,432 | $280,199 | $62,690 | $217,509 |
| 2016 | $3,392 | $274,705 | $61,461 | $213,244 |
| 2015 | $3,365 | $270,579 | $60,538 | $210,041 |
| 2014 | $3,303 | $265,279 | $59,352 | $205,927 |
Source: Public Records
Map
Nearby Homes
- 1049 Evergreen Ct
- 1200 E Highland Ave Unit 207
- 1089 Ardmore Cir
- 1032 Ardmore Cir
- 412 Phlox Ct
- 412 Lotus Ct
- 635 E Palm Ave
- 261 E Crescent Ave
- 1410 Pleasantview Dr
- 1442 Moore St
- 705 Hemlock Ct
- 1452 Moore St
- 1458 Moore St
- 1370 Oak St
- 506 Lytle St
- 1479 Moore St
- 1476 Moore St
- 116 Franklin Ave
- 0 Campbell Ave
- 1550 Marion Rd
- 1024 Everron Ct
- 1074 Everron Ct
- 1053 Lytle St
- 1023 Lytle St
- 1073 Lytle St
- 1004 Everron Ct
- 1051 Everron Ct
- 1071 Everron Ct
- 1021 Everron Ct
- 1003 Lytle St
- 954 Everron Ct
- 1001 Everron Ct
- 951 Lytle St
- 1052 Lytle St
- 1006 Cimarron Ct
- 955 Everron Ct
- 1072 Lytle St
- 1022 Lytle St
- 1010 Cimarron Ct
- 924 Everron Ct
Your Personal Tour Guide
Ask me questions while you tour the home.