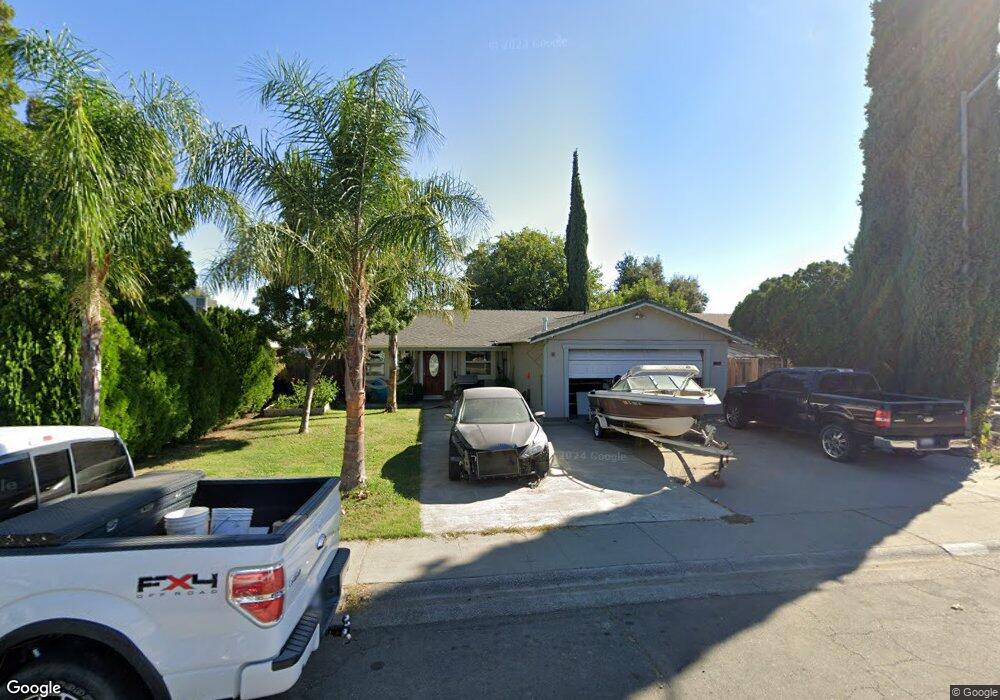
1056 Juniper Dr Willows, CA 95988
Estimated Value: $238,522 - $284,000
2
Beds
3
Baths
1,140
Sq Ft
$235/Sq Ft
Est. Value
About This Home
This home is located at 1056 Juniper Dr, Willows, CA 95988 and is currently estimated at $267,381, approximately $234 per square foot. 1056 Juniper Dr is a home located in Glenn County with nearby schools including Murdock Elementary School, Willows Intermediate School, and Willows High School.
Ownership History
Date
Name
Owned For
Owner Type
Purchase Details
Closed on
Nov 19, 2010
Sold by
Selene Rmof Reo Acquisition Ii Llc
Bought by
Velasquez Martin C and Flores Maria L
Current Estimated Value
Purchase Details
Closed on
Dec 21, 2009
Sold by
Taylor Bean & Whitaker Mortgage Corp
Bought by
Selene Rmof Reo Acquisition Ii Llc
Purchase Details
Closed on
Jul 1, 2008
Sold by
Stokes Nancy
Bought by
Taylor Bean & Whitaker Mortgage Corp
Purchase Details
Closed on
Jun 8, 2007
Sold by
Stokes Nancy
Bought by
Stokes Nancy
Home Financials for this Owner
Home Financials are based on the most recent Mortgage that was taken out on this home.
Original Mortgage
$27,400
Interest Rate
6.16%
Mortgage Type
Stand Alone Second
Create a Home Valuation Report for This Property
The Home Valuation Report is an in-depth analysis detailing your home's value as well as a comparison with similar homes in the area
Home Values in the Area
Average Home Value in this Area
Purchase History
| Date | Buyer | Sale Price | Title Company |
|---|---|---|---|
| Velasquez Martin C | $70,000 | North State Title Co | |
| Selene Rmof Reo Acquisition Ii Llc | -- | Accommodation | |
| Taylor Bean & Whitaker Mortgage Corp | $236,131 | Fidelity Natl Title Ins Co | |
| Stokes Nancy | -- | Lenders Choice Title Company |
Source: Public Records
Mortgage History
| Date | Status | Borrower | Loan Amount |
|---|---|---|---|
| Previous Owner | Stokes Nancy | $27,400 |
Source: Public Records
Tax History
| Year | Tax Paid | Tax Assessment Tax Assessment Total Assessment is a certain percentage of the fair market value that is determined by local assessors to be the total taxable value of land and additions on the property. | Land | Improvement |
|---|---|---|---|---|
| 2025 | $1,804 | $89,670 | $38,430 | $51,240 |
| 2024 | $1,804 | $87,913 | $37,677 | $50,236 |
| 2023 | $1,712 | $86,190 | $36,939 | $49,251 |
| 2022 | $1,614 | $84,501 | $36,215 | $48,286 |
| 2021 | $1,528 | $82,845 | $35,505 | $47,340 |
| 2020 | $1,437 | $81,996 | $35,141 | $46,855 |
| 2019 | $1,431 | $80,389 | $34,452 | $45,937 |
| 2018 | $1,400 | $78,814 | $33,777 | $45,037 |
| 2017 | $1,394 | $77,269 | $33,115 | $44,154 |
| 2016 | $1,334 | $75,755 | $32,466 | $43,289 |
| 2015 | $1,323 | $74,618 | $31,979 | $42,639 |
| 2014 | $1,308 | $73,157 | $31,353 | $41,804 |
Source: Public Records
Map
Nearby Homes
- 939 Elm St
- 629 S Murdock Ave
- 447 S Marshall Ave
- 609 S Lassen St
- 251 S Lassen St
- 151 S Murdock Ave
- 1035 W Walnut St
- 159 159 S Shasta St
- 159 S Shasta St
- 309 N Merrill Ave
- 151 N Shasta St
- 205 N Shasta St
- 266 S Yolo St
- 0 E Oak St
- 650 Pacific Ave
- 145 S Sonoma St
- 1165 Southgate Dr
- 1760 County Road Ff
- 421 5th St
- 633 E Walnut St
- 1046 Juniper Dr
- 1076 Juniper Dr
- 1036 Juniper Dr
- 1086 Juniper Dr
- 1026 Juniper Dr
- 1096 Juniper Dr
- 1045 Juniper Dr
- 1025 Juniper Dr
- 1055 Juniper Dr
- 1015 Juniper Dr
- 1016 Juniper Dr
- 1065 Juniper Dr
- 1106 Juniper Dr
- 995 Juniper Dr
- 1085 Juniper Dr
- 1006 Juniper Dr
- 1116 Juniper Dr
- 975 Juniper Dr
- 1032 Elm St
- 1105 Juniper Dr
Your Personal Tour Guide
Ask me questions while you tour the home.