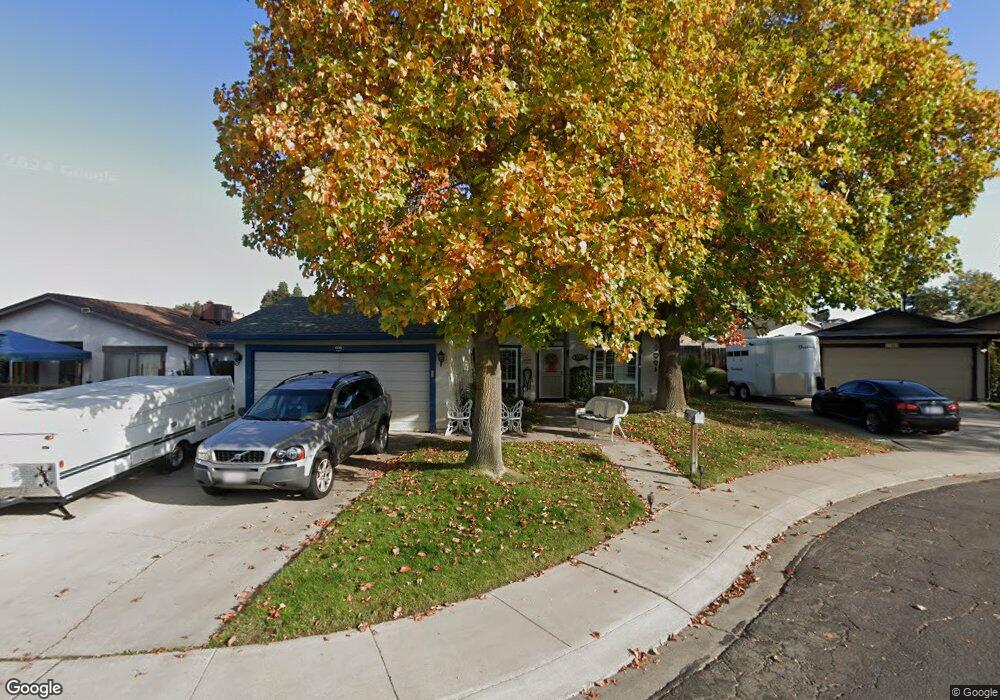
1056 Tobin Place Manteca, CA 95337
Downtown Manteca NeighborhoodEstimated Value: $323,000 - $475,000
3
Beds
2
Baths
1,348
Sq Ft
$322/Sq Ft
Est. Value
About This Home
This home is located at 1056 Tobin Place, Manteca, CA 95337 and is currently estimated at $433,972, approximately $321 per square foot. 1056 Tobin Place is a home located in San Joaquin County with nearby schools including Sequoia Elementary School and Manteca High School.
Ownership History
Date
Name
Owned For
Owner Type
Purchase Details
Closed on
Dec 20, 2005
Sold by
Burrows Wendy L
Bought by
Burrows Jeffery W and Burrows Wendy L
Current Estimated Value
Purchase Details
Closed on
Oct 5, 2005
Sold by
Burrows Jeffery W and Burrows Wendy L
Bought by
Burrows Wendy L
Home Financials for this Owner
Home Financials are based on the most recent Mortgage that was taken out on this home.
Original Mortgage
$254,000
Interest Rate
5.68%
Mortgage Type
New Conventional
Purchase Details
Closed on
Sep 26, 1997
Sold by
Jeffrey Burrows and Burrows Jeffery W
Bought by
Burrows Jeffery W and Burrows Wendy L
Home Financials for this Owner
Home Financials are based on the most recent Mortgage that was taken out on this home.
Original Mortgage
$119,019
Interest Rate
7.54%
Mortgage Type
FHA
Create a Home Valuation Report for This Property
The Home Valuation Report is an in-depth analysis detailing your home's value as well as a comparison with similar homes in the area
Home Values in the Area
Average Home Value in this Area
Purchase History
| Date | Buyer | Sale Price | Title Company |
|---|---|---|---|
| Burrows Jeffery W | -- | None Available | |
| Burrows Wendy L | -- | Fidelity National Title | |
| Burrows Jeffery W | -- | North American Title |
Source: Public Records
Mortgage History
| Date | Status | Borrower | Loan Amount |
|---|---|---|---|
| Closed | Burrows Wendy L | $254,000 | |
| Closed | Burrows Jeffery W | $119,019 |
Source: Public Records
Tax History
| Year | Tax Paid | Tax Assessment Tax Assessment Total Assessment is a certain percentage of the fair market value that is determined by local assessors to be the total taxable value of land and additions on the property. | Land | Improvement |
|---|---|---|---|---|
| 2025 | $1,531 | $143,334 | $55,740 | $87,594 |
| 2024 | $1,486 | $140,525 | $54,648 | $85,877 |
| 2023 | $1,467 | $137,771 | $53,577 | $84,194 |
| 2022 | $1,443 | $135,071 | $52,527 | $82,544 |
| 2021 | $1,426 | $132,424 | $51,498 | $80,926 |
| 2020 | $1,368 | $131,067 | $50,970 | $80,097 |
| 2019 | $1,349 | $128,498 | $49,971 | $78,527 |
| 2018 | $1,330 | $125,980 | $48,992 | $76,988 |
| 2017 | $1,309 | $123,511 | $48,032 | $75,479 |
| 2016 | $1,276 | $121,089 | $47,090 | $73,999 |
| 2014 | $1,185 | $116,935 | $45,475 | $71,460 |
Source: Public Records
Map
Nearby Homes
- 896 Cinnamon Teal Ct
- 865 Locust Ave
- 938 Snowgoose Ln
- 776 Folsom Way
- 1015 Tenaya Ct
- 707 Chenin Blanc Dr
- 778 Mission Ridge Dr
- 1164 Marion St
- 578 Schooner Place
- 628 Mission Ridge Dr
- 1432 Driftwood Way
- 1025 Barbados St
- 1555 Sand Ln
- 119 Almond Ave
- 802 W Center St
- 123 Wawona St
- 1432 Meridian St
- 1444 Meridian St
- 1176 Junction Dr
- 475 Quintal Rd
- 1048 Tobin Place
- 1062 Tobin Place
- 1053 Dill Way
- 1059 Dill Way
- 1040 Tobin Place
- 1010 Merced Way
- 1067 Dill Way
- 1074 Tobin Place
- 1057 Tobin Place
- 1049 Tobin Place
- 1075 Dill Way
- 1063 Tobin Place
- 1041 Tobin Place
- 1075 Tobin Place
- 4098 Snowgoose Ln
- 1048 Dill Way
- 1056 Dill Way
- 1043 Swan Dr
- 1023 Merced Way
- 1035 Merced Way
Your Personal Tour Guide
Ask me questions while you tour the home.