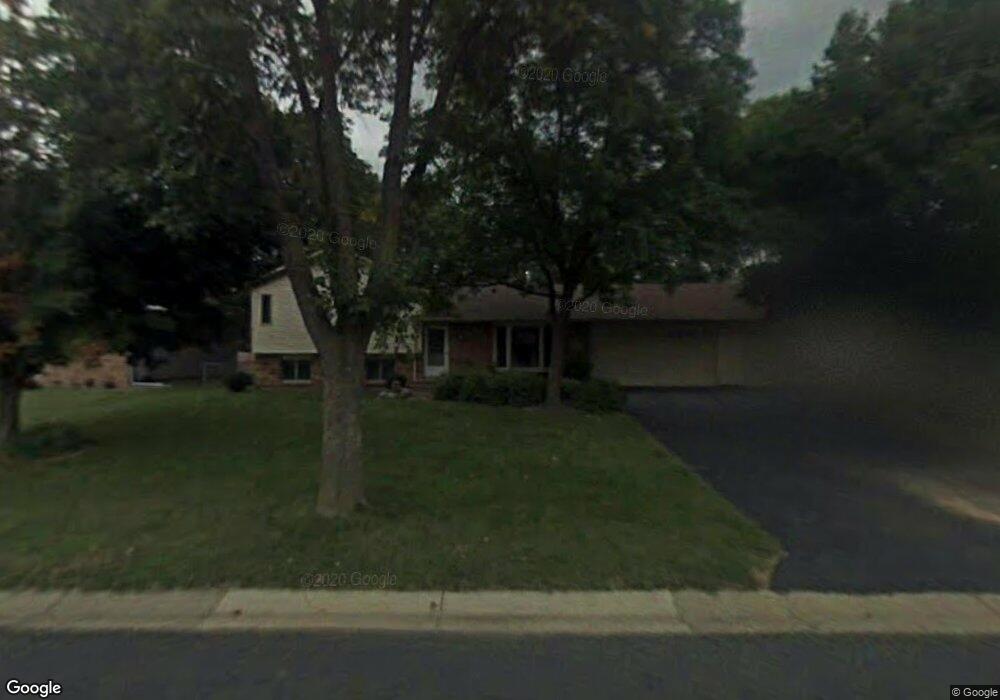
10584 104th Place N Maple Grove, MN 55369
Estimated Value: $425,000 - $486,639
4
Beds
4
Baths
1,030
Sq Ft
$430/Sq Ft
Est. Value
About This Home
This home is located at 10584 104th Place N, Maple Grove, MN 55369 and is currently estimated at $443,410, approximately $430 per square foot. 10584 104th Place N is a home located in Hennepin County with nearby schools including Elm Creek Elementary School, Osseo Middle School, and Osseo Senior High School.
Ownership History
Date
Name
Owned For
Owner Type
Purchase Details
Closed on
Mar 4, 2019
Sold by
Moore Simonson Teresa C and Moore John
Bought by
Janssen Randy John and Janssen Heidi Marie
Current Estimated Value
Home Financials for this Owner
Home Financials are based on the most recent Mortgage that was taken out on this home.
Original Mortgage
$248,720
Outstanding Balance
$220,862
Interest Rate
4.4%
Mortgage Type
New Conventional
Estimated Equity
$200,172
Purchase Details
Closed on
Sep 7, 2016
Sold by
Moore John N and Simonson Teresa C
Bought by
Moore John M and Simonson Teresa C
Purchase Details
Closed on
Jan 28, 2016
Sold by
Ebert Michael E and Ebert Elena I
Bought by
Moore John N and Simonson Teresa
Purchase Details
Closed on
Dec 3, 2001
Sold by
Ebert Thomas R
Bought by
Ebert Michael E
Purchase Details
Closed on
Jun 25, 1999
Sold by
Gentile Neale and Gentile Deborah
Bought by
Ebert Thomas
Purchase Details
Closed on
Nov 29, 1996
Sold by
Reiter Mark B and Reiter Lauri
Bought by
Gentile Neale A
Create a Home Valuation Report for This Property
The Home Valuation Report is an in-depth analysis detailing your home's value as well as a comparison with similar homes in the area
Home Values in the Area
Average Home Value in this Area
Purchase History
| Date | Buyer | Sale Price | Title Company |
|---|---|---|---|
| Janssen Randy John | $310,900 | None Available | |
| Moore John M | -- | Attorney | |
| Moore John N | $250,000 | Clear Title Llc | |
| Ebert Michael E | $145,000 | -- | |
| Ebert Thomas | $133,000 | -- | |
| Gentile Neale A | $116,000 | -- |
Source: Public Records
Mortgage History
| Date | Status | Borrower | Loan Amount |
|---|---|---|---|
| Open | Janssen Randy John | $248,720 | |
| Previous Owner | Ebert Michael E | $171,050 |
Source: Public Records
Tax History Compared to Growth
Tax History
| Year | Tax Paid | Tax Assessment Tax Assessment Total Assessment is a certain percentage of the fair market value that is determined by local assessors to be the total taxable value of land and additions on the property. | Land | Improvement |
|---|---|---|---|---|
| 2023 | $5,385 | $459,100 | $119,800 | $339,300 |
| 2022 | $4,562 | $455,800 | $109,800 | $346,000 |
| 2021 | $4,241 | $378,500 | $82,100 | $296,400 |
| 2020 | $3,668 | $348,400 | $68,300 | $280,100 |
| 2019 | $3,599 | $291,000 | $66,700 | $224,300 |
| 2018 | $3,380 | $271,600 | $56,400 | $215,200 |
| 2017 | $3,203 | $232,000 | $57,000 | $175,000 |
| 2016 | $3,118 | $223,800 | $56,000 | $167,800 |
| 2015 | $2,842 | $201,500 | $42,000 | $159,500 |
| 2014 | -- | $195,000 | $50,600 | $144,400 |
Source: Public Records
Map
Nearby Homes
- 10315 Boundary Creek Terrace
- 10655 103rd Ave N
- 10432 102nd Place N
- 14927 106th Ave N
- 10929 108th Ave N
- 9998 106th Place N
- 9915 106th Place N
- 9962 107th Place N
- 10020 Trenton Ln N
- 10740 99th Place N
- 10544 Lancaster Ln N
- 10556 Lancaster Ln N
- 11132 100th Place N
- 10738 Zopfi Way E
- 10167 99th Place N
- 10535 Forestview Cir N
- 10426 Hidden Oaks Ln N
- 10512 Hidden Oaks Ln N
- 11260 Hidden Oaks Ct N
- 9762 Monticello Ln N
- 10622 104th Place N
- 10577 105th Ave N
- 10603 105th Ave N
- 10551 105th Ave N
- 10532 104th Place N
- 10581 104th Place N
- 10635 105th Ave N
- 10656 104th Place N
- 10557 104th Place N
- 10525 105th Ave N
- 10621 104th Place N
- 10531 104th Place N
- 10506 104th Place N
- 10692 104th Place N
- 10667 105th Ave N
- 10655 104th Place N
- 10501 105th Ave N
- 10508 Union Terrace Ln N
- 10505 104th Place N
- 10658 105th Ave N