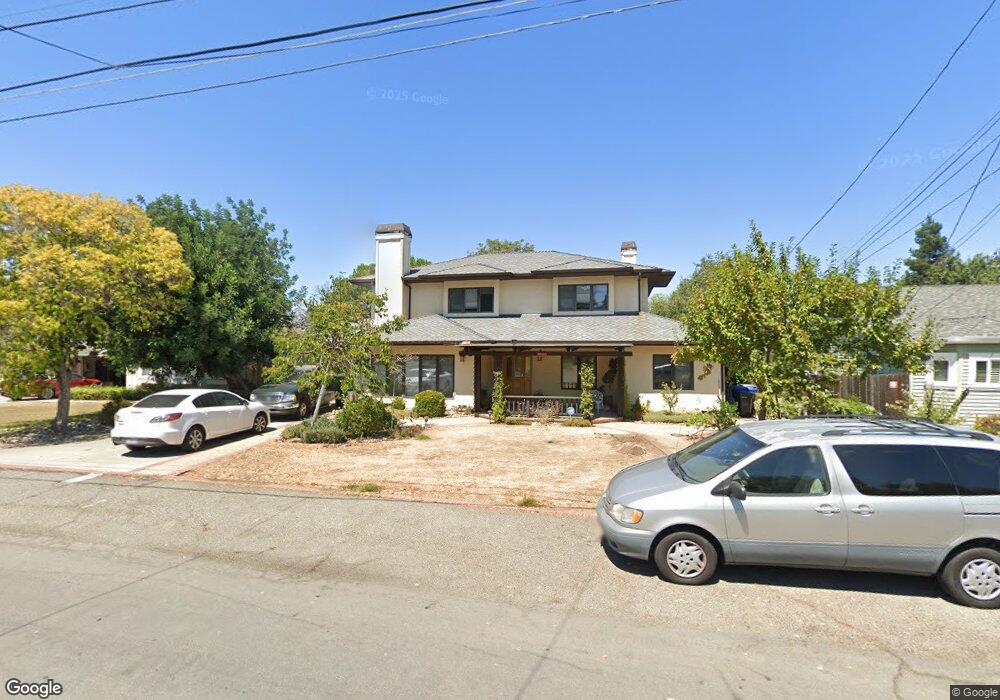
1073 Lucot Way Campbell, CA 95008
San Tomas NeighborhoodEstimated Value: $2,669,000 - $3,374,292
5
Beds
5
Baths
1,170
Sq Ft
$2,467/Sq Ft
Est. Value
About This Home
This home is located at 1073 Lucot Way, Campbell, CA 95008 and is currently estimated at $2,886,573, approximately $2,467 per square foot. 1073 Lucot Way is a home located in Santa Clara County with nearby schools including Westmont High School, Village School, and Capri Elementary.
Ownership History
Date
Name
Owned For
Owner Type
Purchase Details
Closed on
Sep 14, 2021
Sold by
Falahati 2017 Revocable Trust and Falahati Darioush
Bought by
Falahati Darioush and Falahati Shahnaz
Current Estimated Value
Home Financials for this Owner
Home Financials are based on the most recent Mortgage that was taken out on this home.
Original Mortgage
$548,250
Outstanding Balance
$418,482
Interest Rate
2.1%
Mortgage Type
New Conventional
Estimated Equity
$2,468,091
Purchase Details
Closed on
Mar 27, 2017
Sold by
Falahati Darioush and Falahati Shahnaz
Bought by
Falahati Darioush and Falahati Shahnaz
Purchase Details
Closed on
Mar 10, 1995
Sold by
Mallory Chester L and Oliver Susan A
Bought by
Falahati Darioush and Falahati Shahnaz
Home Financials for this Owner
Home Financials are based on the most recent Mortgage that was taken out on this home.
Original Mortgage
$396,000
Interest Rate
8.87%
Purchase Details
Closed on
Apr 22, 1994
Sold by
Mallory Chester L and Oliver Susan Allen
Bought by
Mallory Chester L and Oliver Susan A
Create a Home Valuation Report for This Property
The Home Valuation Report is an in-depth analysis detailing your home's value as well as a comparison with similar homes in the area
Home Values in the Area
Average Home Value in this Area
Purchase History
| Date | Buyer | Sale Price | Title Company |
|---|---|---|---|
| Falahati Darioush | -- | None Listed On Document | |
| Falahati Darioush | -- | None Available | |
| Falahati Darioush | $495,000 | First American Title Guarant | |
| Mallory Chester L | -- | -- | |
| Mallory Chester A | -- | -- |
Source: Public Records
Mortgage History
| Date | Status | Borrower | Loan Amount |
|---|---|---|---|
| Open | Falahati Darioush | $548,250 | |
| Previous Owner | Falahati Darioush | $396,000 |
Source: Public Records
Tax History Compared to Growth
Tax History
| Year | Tax Paid | Tax Assessment Tax Assessment Total Assessment is a certain percentage of the fair market value that is determined by local assessors to be the total taxable value of land and additions on the property. | Land | Improvement |
|---|---|---|---|---|
| 2025 | $10,856 | $831,424 | $483,740 | $347,684 |
| 2024 | $10,856 | $815,122 | $474,255 | $340,867 |
| 2023 | $10,856 | $799,140 | $464,956 | $334,184 |
| 2022 | $10,659 | $783,472 | $455,840 | $327,632 |
| 2021 | $10,376 | $768,110 | $446,902 | $321,208 |
| 2020 | $10,104 | $760,235 | $442,320 | $317,915 |
| 2019 | $9,956 | $745,330 | $433,648 | $311,682 |
| 2018 | $9,646 | $730,717 | $425,146 | $305,571 |
| 2017 | $9,503 | $716,390 | $416,810 | $299,580 |
| 2016 | $8,935 | $702,344 | $408,638 | $293,706 |
| 2015 | $8,779 | $691,795 | $402,500 | $289,295 |
| 2014 | $8,459 | $678,245 | $394,616 | $283,629 |
Source: Public Records
Map
Nearby Homes
- 1170 Steinway Ave
- 14145 Capri Dr
- 1097-1099 W Hacienda Ave
- 101 Peach Willow Ct
- 207 Palmer Dr
- 14375 La Rinconada Dr
- 615 Chapman Dr
- 915 Bucknam Ave
- 14225 Lora Dr Unit 90
- 14225 Lora Dr Unit 36
- 14225 Lora Dr Unit 70
- 1162 Capri Dr
- 107 Naramore Ln
- 1152 Capri Dr
- 668 W Sunnyoaks Ave
- 112 Mozart Ave
- 440 W Hacienda Ave
- 1329 Elam Ave
- 614 Beta Ct
- 14685 Oka Rd Unit 11
- 1081 Lucot Way
- 1061 Lucot Way
- 1091 Lucot Way
- 1049 Lucot Way
- 1090 Audrey Ave
- 1068 Audrey Ave
- 1102 Audrey Ave
- 1062 Lucot Way
- 1074 Lucot Way
- 1504 Oburn Ct
- 1037 Lucot Way
- 1056 Audrey Ave
- 1506 Oburn Ct
- 1050 Lucot Way
- 1082 Lucot Way
- 1092 Lucot Way
- 1106 Audrey Ave
- 1038 Lucot Way
- 1027 Lucot Way
- 1044 Audrey Ave