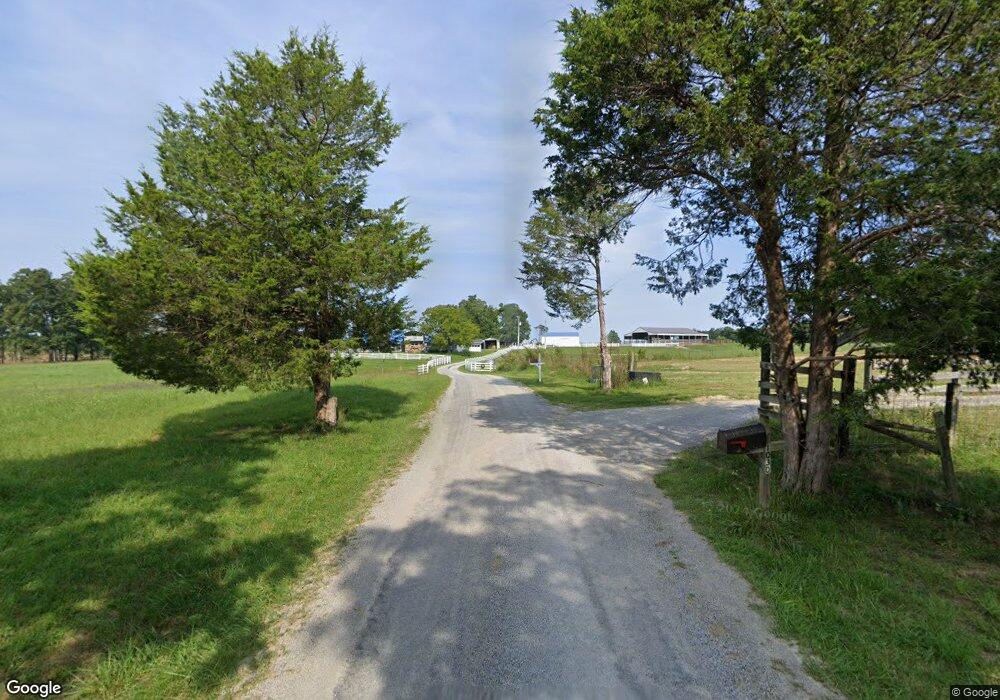
1099 Kilby Rd Unit JOHN Clarkrange, TN 38553
Estimated Value: $493,000 - $764,000
--
Bed
2
Baths
2,872
Sq Ft
$222/Sq Ft
Est. Value
About This Home
This home is located at 1099 Kilby Rd Unit JOHN, Clarkrange, TN 38553 and is currently estimated at $636,790, approximately $221 per square foot. 1099 Kilby Rd Unit JOHN is a home located in Fentress County.
Ownership History
Date
Name
Owned For
Owner Type
Purchase Details
Closed on
Dec 15, 2023
Sold by
Mcdonald Nicholas T and Mcdonald Melissa Sue
Bought by
Ramsey Phillip and Ramsey Kristy
Current Estimated Value
Purchase Details
Closed on
Jul 18, 2022
Sold by
Wheeler Jr Robert F
Bought by
Miller Michael
Purchase Details
Closed on
Aug 16, 2018
Sold by
Baker Larry David and Baker Pamela Yvonne
Bought by
Baker Coleman David
Purchase Details
Closed on
Oct 15, 1999
Bought by
Baker Larry D and Baker Pamela Y
Purchase Details
Closed on
Jun 5, 1997
Bought by
Overby Hugh and Overby Tom B
Purchase Details
Closed on
Jan 13, 1997
Bought by
Grote Norman R Jane
Create a Home Valuation Report for This Property
The Home Valuation Report is an in-depth analysis detailing your home's value as well as a comparison with similar homes in the area
Home Values in the Area
Average Home Value in this Area
Purchase History
| Date | Buyer | Sale Price | Title Company |
|---|---|---|---|
| Ramsey Phillip | $630,000 | None Listed On Document | |
| Ramsey Phillip | $630,000 | None Listed On Document | |
| Miller Michael | $125,000 | Deaton Harold E | |
| Miller Michael | $125,000 | Deaton Harold E | |
| Baker Coleman David | $368,300 | None Available | |
| Baker Larry D | $180,000 | -- | |
| Overby Hugh | $180,000 | -- | |
| Grote Norman R Jane | $159,900 | -- |
Source: Public Records
Tax History Compared to Growth
Tax History
| Year | Tax Paid | Tax Assessment Tax Assessment Total Assessment is a certain percentage of the fair market value that is determined by local assessors to be the total taxable value of land and additions on the property. | Land | Improvement |
|---|---|---|---|---|
| 2025 | $1,222 | $85,700 | $0 | $0 |
| 2024 | $1,222 | $90,500 | $27,400 | $63,100 |
| 2023 | $1,249 | $92,500 | $29,400 | $63,100 |
| 2022 | $1,032 | $54,025 | $21,050 | $32,975 |
| 2021 | $1,032 | $54,025 | $21,050 | $32,975 |
| 2020 | $1,032 | $54,025 | $21,050 | $32,975 |
| 2019 | $1,032 | $54,025 | $21,050 | $32,975 |
| 2018 | $1,032 | $92,075 | $59,100 | $32,975 |
| 2017 | $1,062 | $53,525 | $18,675 | $34,850 |
| 2016 | $1,062 | $53,525 | $18,675 | $34,850 |
| 2015 | $1,062 | $53,539 | $0 | $0 |
| 2014 | $1,062 | $53,539 | $0 | $0 |
Source: Public Records
Map
Nearby Homes
- 634 Robs Rd
- 00 Fox Ridge Dr
- 338 Swallows Crossing
- 1011 Fox Ridge Dr
- 1174 Hargis Rd
- 6006 S York Hwy
- 5740 S York Hwy
- 145 Rhum Rd
- 6105 S York Hwy
- 5424 Wilder Rd
- 1383 Old Bean Shed Rd
- 101 MacA Ridge Cir
- 106 MacA Ridge Cir
- 6105 S South York Hwy
- 0 Wilder Rd
- 1101 Franklin Loop
- 545 Shelby Way
- 5550 S York Hwy
- 5317 Wilder Rd
- 5534 S York Hwy
- 1020 Kilby Rd
- 986 Kilby Rd Unit JOHN
- 1030 Kilby Rd
- 1067 South Ln
- 984 Kilby Rd Unit JOHN
- 984 Kilby Rd
- 1051 South Ln
- 985 Kilby Rd
- 1070 South Ln
- 1058 South Ln
- 958 Kilby Rd Unit JOHN
- 1079 South Ln
- 1003 South Ln
- - South Ln
- 0 South Ln Unit 591311
- 0 South Ln Unit 592682
- 0 South Ln Unit 593495
- 0 South Ln Unit 618822
- 0 South Ln Unit 659834
- 0 South Ln Unit 821677