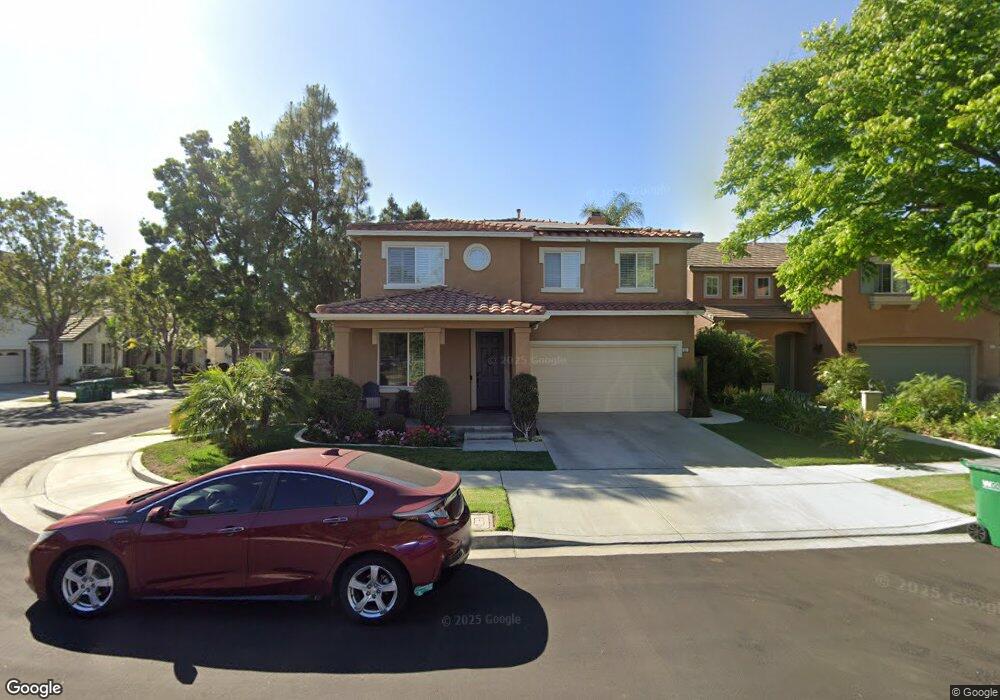
11 Capistrano Irvine, CA 92602
Lower Peters Canyon NeighborhoodEstimated Value: $1,632,000 - $2,105,000
4
Beds
3
Baths
2,231
Sq Ft
$837/Sq Ft
Est. Value
About This Home
This home is located at 11 Capistrano, Irvine, CA 92602 and is currently estimated at $1,868,229, approximately $837 per square foot. 11 Capistrano is a home located in Orange County with nearby schools including Hicks Canyon Elementary School, Orchard Hills School, and Arnold O. Beckman High School.
Ownership History
Date
Name
Owned For
Owner Type
Purchase Details
Closed on
Sep 26, 2024
Sold by
Unkle/Paque Family Trust and Unkle Patrick A
Bought by
Unkle Patrick A and Paque Annette C
Current Estimated Value
Home Financials for this Owner
Home Financials are based on the most recent Mortgage that was taken out on this home.
Original Mortgage
$730,331
Outstanding Balance
$722,812
Interest Rate
6.46%
Mortgage Type
VA
Estimated Equity
$1,145,417
Purchase Details
Closed on
Nov 3, 2004
Sold by
Unkle Patrick A and Paque Annette
Bought by
Unkle Patrick A and Paque Annette C
Purchase Details
Closed on
Sep 25, 2002
Sold by
California Pacific Homes Inc
Bought by
Unkle Patrick A and Paque Annette
Home Financials for this Owner
Home Financials are based on the most recent Mortgage that was taken out on this home.
Original Mortgage
$434,650
Interest Rate
6.28%
Create a Home Valuation Report for This Property
The Home Valuation Report is an in-depth analysis detailing your home's value as well as a comparison with similar homes in the area
Home Values in the Area
Average Home Value in this Area
Purchase History
| Date | Buyer | Sale Price | Title Company |
|---|---|---|---|
| Unkle Patrick A | -- | None Listed On Document | |
| Unkle Patrick A | -- | -- | |
| Unkle Patrick A | $511,500 | Fidelity National Title Co |
Source: Public Records
Mortgage History
| Date | Status | Borrower | Loan Amount |
|---|---|---|---|
| Open | Unkle Patrick A | $730,331 | |
| Previous Owner | Unkle Patrick A | $434,650 |
Source: Public Records
Tax History
| Year | Tax Paid | Tax Assessment Tax Assessment Total Assessment is a certain percentage of the fair market value that is determined by local assessors to be the total taxable value of land and additions on the property. | Land | Improvement |
|---|---|---|---|---|
| 2025 | $8,551 | $743,105 | $502,279 | $240,826 |
| 2024 | $8,551 | $728,535 | $492,431 | $236,104 |
| 2023 | $8,406 | $714,250 | $482,775 | $231,475 |
| 2022 | $8,244 | $700,246 | $473,309 | $226,937 |
| 2021 | $9,457 | $686,516 | $464,028 | $222,488 |
| 2020 | $9,379 | $679,477 | $459,270 | $220,207 |
| 2019 | $9,187 | $666,154 | $450,264 | $215,890 |
| 2018 | $9,016 | $653,093 | $441,436 | $211,657 |
| 2017 | $8,824 | $640,288 | $432,781 | $207,507 |
| 2016 | $8,679 | $627,734 | $424,295 | $203,439 |
| 2015 | $8,569 | $618,305 | $417,921 | $200,384 |
| 2014 | $8,439 | $606,194 | $409,735 | $196,459 |
Source: Public Records
Map
Nearby Homes
Your Personal Tour Guide
Ask me questions while you tour the home.