Estimated Value: $376,000 - $432,000
3
Beds
2
Baths
998
Sq Ft
$401/Sq Ft
Est. Value
About This Home
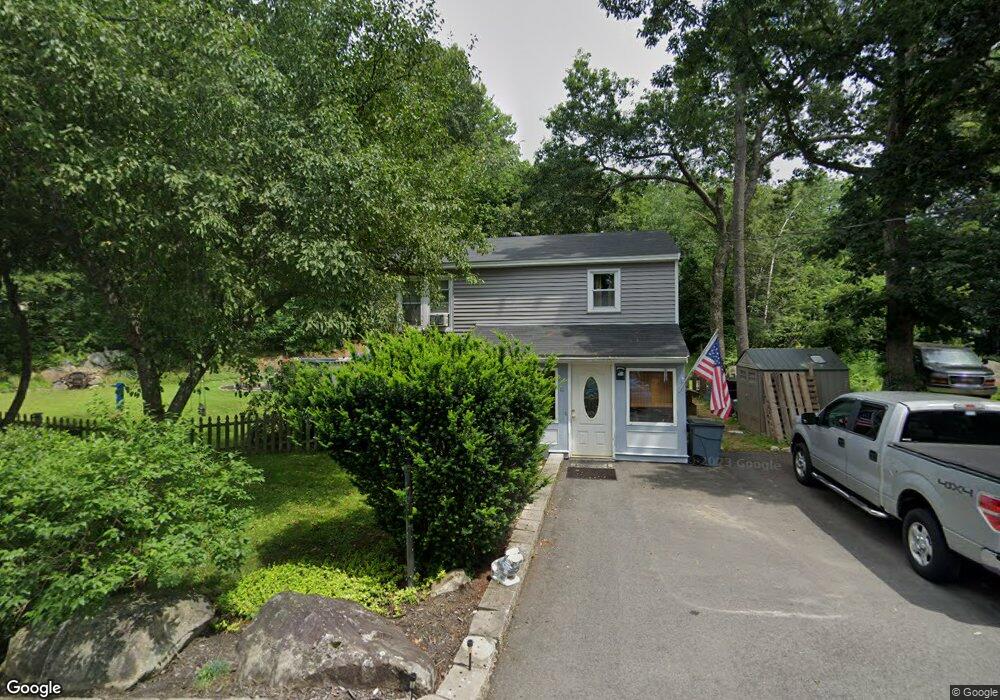
This home is located at 11 Hilda Ave, Derry, NH 03038 and is currently estimated at $400,226, approximately $401 per square foot. 11 Hilda Ave is a home located in Rockingham County with nearby schools including Ernest P. Barka Elementary School, Gilbert H. Hood Middle School, and Pinkerton Academy.
Ownership History
Date
Name
Owned For
Owner Type
Purchase Details
Closed on
Jun 26, 2003
Sold by
Demers Crystal L
Bought by
Dehart John R and Dehart Kristy A
Current Estimated Value
Home Financials for this Owner
Home Financials are based on the most recent Mortgage that was taken out on this home.
Original Mortgage
$162,900
Interest Rate
5.53%
Purchase Details
Closed on
Jul 25, 2000
Sold by
Ramos Richard S and Ramos Sharyn R
Bought by
Demers Crystal L
Home Financials for this Owner
Home Financials are based on the most recent Mortgage that was taken out on this home.
Original Mortgage
$119,479
Interest Rate
8.28%
Create a Home Valuation Report for This Property
The Home Valuation Report is an in-depth analysis detailing your home's value as well as a comparison with similar homes in the area
Home Values in the Area
Average Home Value in this Area
Purchase History
| Date | Buyer | Sale Price | Title Company |
|---|---|---|---|
| Dehart John R | $162,900 | -- | |
| Demers Crystal L | $123,000 | -- |
Source: Public Records
Mortgage History
| Date | Status | Borrower | Loan Amount |
|---|---|---|---|
| Open | Demers Crystal L | $189,200 | |
| Closed | Demers Crystal L | $201,000 | |
| Closed | Demers Crystal L | $162,900 | |
| Previous Owner | Demers Crystal L | $119,479 |
Source: Public Records
Tax History Compared to Growth
Tax History
| Year | Tax Paid | Tax Assessment Tax Assessment Total Assessment is a certain percentage of the fair market value that is determined by local assessors to be the total taxable value of land and additions on the property. | Land | Improvement |
|---|---|---|---|---|
| 2024 | $6,794 | $363,500 | $209,700 | $153,800 |
| 2023 | $6,407 | $309,800 | $202,600 | $107,200 |
| 2022 | $5,899 | $309,800 | $202,600 | $107,200 |
| 2021 | $5,536 | $223,600 | $150,100 | $73,500 |
| 2020 | $5,442 | $223,600 | $150,100 | $73,500 |
| 2019 | $4,848 | $185,600 | $118,200 | $67,400 |
| 2018 | $4,831 | $185,600 | $118,200 | $67,400 |
| 2017 | $4,537 | $157,200 | $89,800 | $67,400 |
| 2016 | $4,254 | $157,200 | $89,800 | $67,400 |
| 2015 | $4,376 | $149,700 | $89,800 | $59,900 |
| 2014 | $4,404 | $149,700 | $89,800 | $59,900 |
| 2013 | $4,500 | $142,900 | $82,300 | $60,600 |
Source: Public Records
Map
Nearby Homes