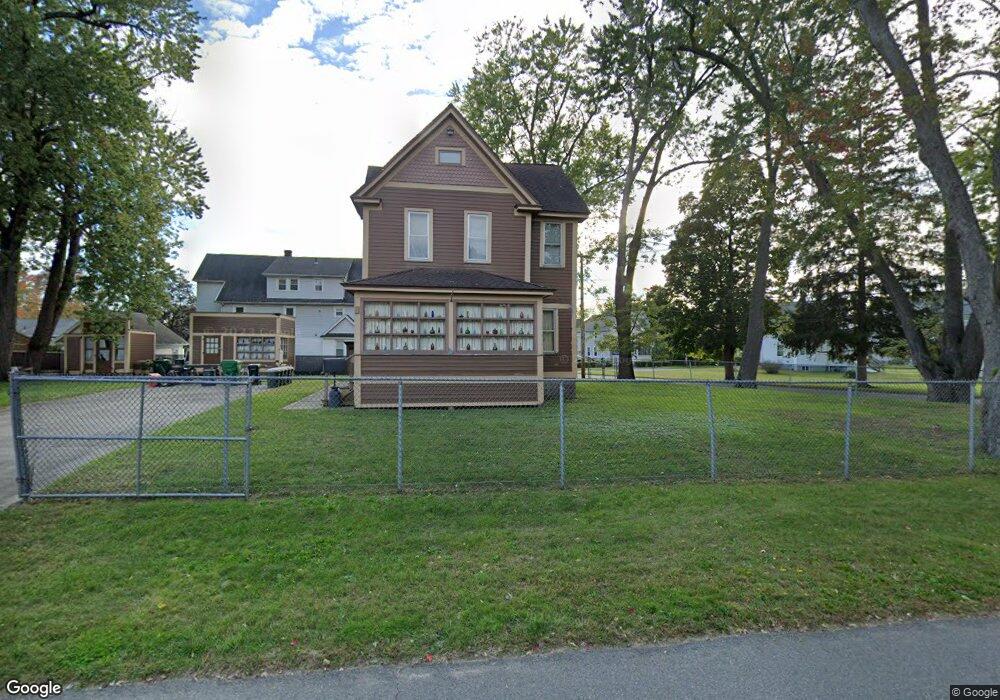
11 Oliver St Chicopee, MA 01020
Chicopee Falls NeighborhoodEstimated Value: $260,000 - $296,000
2
Beds
1
Bath
1,374
Sq Ft
$201/Sq Ft
Est. Value
About This Home
This home is located at 11 Oliver St, Chicopee, MA 01020 and is currently estimated at $276,817, approximately $201 per square foot. 11 Oliver St is a home located in Hampden County with nearby schools including Belcher Elementary School, Bellamy Middle School, and Chicopee High School.
Ownership History
Date
Name
Owned For
Owner Type
Purchase Details
Closed on
May 23, 2024
Sold by
Tryba Suzanne H
Bought by
Tryba Ft and Galusinscaia
Current Estimated Value
Purchase Details
Closed on
Jun 17, 1991
Sold by
Thibault Edwin N
Bought by
Thibault Edwin N and Tryba Suzanne H
Home Financials for this Owner
Home Financials are based on the most recent Mortgage that was taken out on this home.
Original Mortgage
$80,000
Interest Rate
9.39%
Mortgage Type
Purchase Money Mortgage
Create a Home Valuation Report for This Property
The Home Valuation Report is an in-depth analysis detailing your home's value as well as a comparison with similar homes in the area
Home Values in the Area
Average Home Value in this Area
Purchase History
| Date | Buyer | Sale Price | Title Company |
|---|---|---|---|
| Tryba Ft | -- | None Available | |
| Tryba Ft | -- | None Available | |
| Thibault Edwin N | $71,000 | -- | |
| Thibault Edwin N | $71,000 | -- |
Source: Public Records
Mortgage History
| Date | Status | Borrower | Loan Amount |
|---|---|---|---|
| Previous Owner | Thibault Edwin N | $80,000 |
Source: Public Records
Tax History
| Year | Tax Paid | Tax Assessment Tax Assessment Total Assessment is a certain percentage of the fair market value that is determined by local assessors to be the total taxable value of land and additions on the property. | Land | Improvement |
|---|---|---|---|---|
| 2025 | $3,540 | $233,500 | $102,500 | $131,000 |
| 2024 | $3,358 | $227,500 | $100,400 | $127,100 |
| 2023 | $3,144 | $207,500 | $91,300 | $116,200 |
| 2022 | $3,004 | $176,800 | $79,400 | $97,400 |
| 2021 | $3,858 | $160,700 | $72,100 | $88,600 |
| 2020 | $3,387 | $154,500 | $72,100 | $82,400 |
| 2019 | $2,669 | $148,600 | $72,100 | $76,500 |
| 2018 | $2,585 | $141,200 | $68,700 | $72,500 |
| 2017 | $2,680 | $154,800 | $68,700 | $86,100 |
| 2016 | $2,555 | $151,100 | $68,700 | $82,400 |
| 2015 | $2,598 | $148,100 | $68,700 | $79,400 |
| 2014 | $974 | $148,100 | $68,700 | $79,400 |
Source: Public Records
Map
Nearby Homes
- 30 Butler Ave
- 156 East St
- 104 Madison St
- 33 Washington St
- 95 Washington St
- 181 Beauchamp Terrace
- 101 Huntington Ave
- 238 E Main St
- 105 Lachine St
- 104 Chateaugay St
- 45 Hastings St
- 70 Chateaugay St
- 112 W Canton Cir
- 1730 Carew St
- 15 Hyde Ave
- 66 Bromont St
- 251 Edendale St
- 23 Jackson St
- 225 Osborne Terrace
- 251 Fuller Rd
Your Personal Tour Guide
Ask me questions while you tour the home.