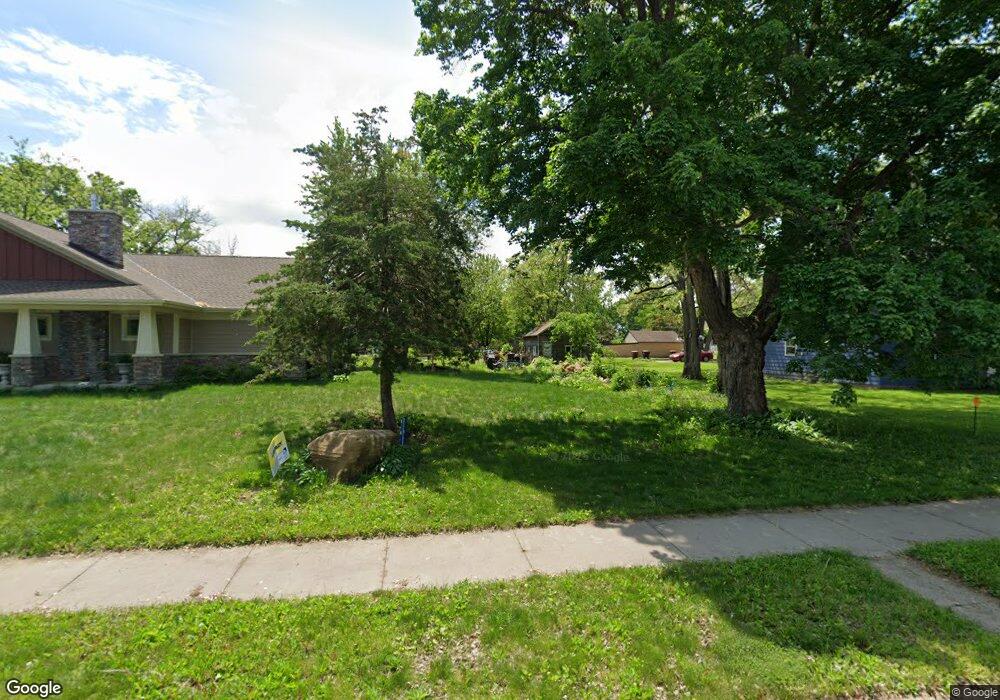
1106 2nd St E Hastings, MN 55033
Hastings-Marshan Township NeighborhoodEstimated Value: $392,000 - $483,598
2
Beds
2
Baths
1,995
Sq Ft
$217/Sq Ft
Est. Value
About This Home
This home is located at 1106 2nd St E, Hastings, MN 55033 and is currently estimated at $433,900, approximately $217 per square foot. 1106 2nd St E is a home located in Dakota County with nearby schools including Kennedy Elementary School, Hastings Middle School, and Hastings High School.
Ownership History
Date
Name
Owned For
Owner Type
Purchase Details
Closed on
Aug 31, 2021
Sold by
Johnson Spencer St Jamesa
Bought by
Johnson Spencer St James and Wagner Cynthia L
Current Estimated Value
Home Financials for this Owner
Home Financials are based on the most recent Mortgage that was taken out on this home.
Original Mortgage
$612,500
Interest Rate
2.8%
Mortgage Type
Construction
Purchase Details
Closed on
May 10, 1996
Sold by
Mollick Estate R
Bought by
St James Johnson Spencer
Create a Home Valuation Report for This Property
The Home Valuation Report is an in-depth analysis detailing your home's value as well as a comparison with similar homes in the area
Home Values in the Area
Average Home Value in this Area
Purchase History
| Date | Buyer | Sale Price | Title Company |
|---|---|---|---|
| Johnson Spencer St James | -- | Dca Title | |
| St James Johnson Spencer | $65,000 | -- |
Source: Public Records
Mortgage History
| Date | Status | Borrower | Loan Amount |
|---|---|---|---|
| Closed | Johnson Spencer St James | $612,500 |
Source: Public Records
Tax History
| Year | Tax Paid | Tax Assessment Tax Assessment Total Assessment is a certain percentage of the fair market value that is determined by local assessors to be the total taxable value of land and additions on the property. | Land | Improvement |
|---|---|---|---|---|
| 2024 | $5,706 | $488,500 | $82,300 | $406,200 |
| 2023 | $5,706 | $494,000 | $82,400 | $411,600 |
| 2022 | $2,104 | $236,100 | $85,000 | $151,100 |
| 2021 | $1,974 | $187,500 | $73,900 | $113,600 |
| 2020 | $2,110 | $176,600 | $70,400 | $106,200 |
| 2019 | $2,013 | $181,300 | $67,000 | $114,300 |
| 2018 | $1,799 | $166,700 | $63,800 | $102,900 |
| 2017 | $1,586 | $147,700 | $60,800 | $86,900 |
| 2016 | $1,679 | $133,500 | $56,800 | $76,700 |
| 2015 | $1,680 | $111,763 | $45,049 | $66,714 |
| 2014 | -- | $112,635 | $43,498 | $69,137 |
| 2013 | -- | $93,124 | $37,374 | $55,750 |
Source: Public Records
Map
Nearby Homes
Your Personal Tour Guide
Ask me questions while you tour the home.