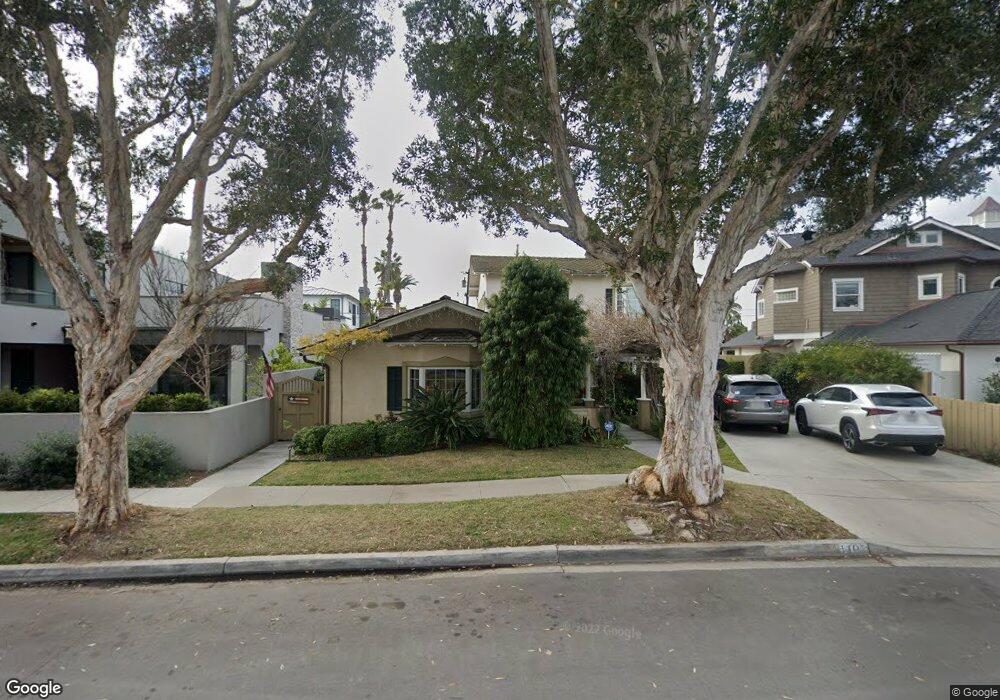
1107 Pine St Coronado, CA 92118
Estimated Value: $3,800,000 - $6,165,000
4
Beds
3
Baths
2,822
Sq Ft
$1,712/Sq Ft
Est. Value
About This Home
This home is located at 1107 Pine St, Coronado, CA 92118 and is currently estimated at $4,830,249, approximately $1,711 per square foot. 1107 Pine St is a home located in San Diego County with nearby schools including Coronado Village Elementary, Coronado Middle School, and Coronado High School.
Ownership History
Date
Name
Owned For
Owner Type
Purchase Details
Closed on
Jun 24, 2003
Sold by
Sonne Scott W and Sonne Ann M
Bought by
Sonne Scott W and Sonne Ann M
Current Estimated Value
Purchase Details
Closed on
Feb 14, 2002
Sold by
Knop David E and Knop Sue A
Bought by
Sonne Scott W and Sonne Ann M
Purchase Details
Closed on
Sep 2, 1998
Sold by
Knop David E and Knop Sue Anne
Bought by
Knop David E and Knop Sue A
Home Financials for this Owner
Home Financials are based on the most recent Mortgage that was taken out on this home.
Original Mortgage
$50,000
Interest Rate
6.68%
Mortgage Type
Credit Line Revolving
Purchase Details
Closed on
Jul 7, 1998
Sold by
Parham William B
Bought by
Knop David E and Knop Sue Anne
Home Financials for this Owner
Home Financials are based on the most recent Mortgage that was taken out on this home.
Original Mortgage
$50,000
Interest Rate
6.68%
Mortgage Type
Credit Line Revolving
Create a Home Valuation Report for This Property
The Home Valuation Report is an in-depth analysis detailing your home's value as well as a comparison with similar homes in the area
Home Values in the Area
Average Home Value in this Area
Purchase History
| Date | Buyer | Sale Price | Title Company |
|---|---|---|---|
| Sonne Scott W | -- | -- | |
| Sonne Scott W | -- | -- | |
| Sonne Scott W | $1,350,000 | California Title Company | |
| Knop David E | -- | -- | |
| Knop David E | $615,000 | First American Title |
Source: Public Records
Mortgage History
| Date | Status | Borrower | Loan Amount |
|---|---|---|---|
| Previous Owner | Knop David E | $50,000 | |
| Previous Owner | Knop David E | $350,000 |
Source: Public Records
Tax History
| Year | Tax Paid | Tax Assessment Tax Assessment Total Assessment is a certain percentage of the fair market value that is determined by local assessors to be the total taxable value of land and additions on the property. | Land | Improvement |
|---|---|---|---|---|
| 2025 | $22,948 | $2,176,093 | $1,477,295 | $698,798 |
| 2024 | $22,948 | $2,133,426 | $1,448,329 | $685,097 |
| 2023 | $22,579 | $2,091,595 | $1,419,931 | $671,664 |
| 2022 | $22,149 | $2,050,585 | $1,392,090 | $658,495 |
| 2021 | $21,818 | $2,010,379 | $1,364,795 | $645,584 |
| 2020 | $21,203 | $1,989,766 | $1,350,801 | $638,965 |
| 2019 | $21,130 | $1,950,752 | $1,324,315 | $626,437 |
| 2018 | $20,766 | $1,912,503 | $1,298,349 | $614,154 |
| 2017 | $20,393 | $1,875,004 | $1,272,892 | $602,112 |
| 2016 | $19,768 | $1,838,240 | $1,247,934 | $590,306 |
| 2015 | $19,459 | $1,810,629 | $1,229,189 | $581,440 |
| 2014 | $18,482 | $1,726,141 | $1,205,111 | $521,030 |
Source: Public Records
Map
Nearby Homes
- 1100 Pine St
- 535 Ocean Blvd
- 120 Carob Way
- 1027 G Ave
- 920 Country Club Ln
- 909 Olive Ave
- 811 10th St
- 812 H Ave
- 1074 Isabella Ave
- 1060 Isabella Ave
- 1054 Isabella Ave Unit 58
- 1056 Isabella Ave
- 1058 Isabella Ave
- 816 F Ave
- 848 E Ave Unit L2
- 763 G Ave
- 911 9th St
- 1155 Star Park Cir Unit 1A
- 1155 Star Park Cir Unit 1D
- 1155 Star Park Cir Unit 1B
Your Personal Tour Guide
Ask me questions while you tour the home.