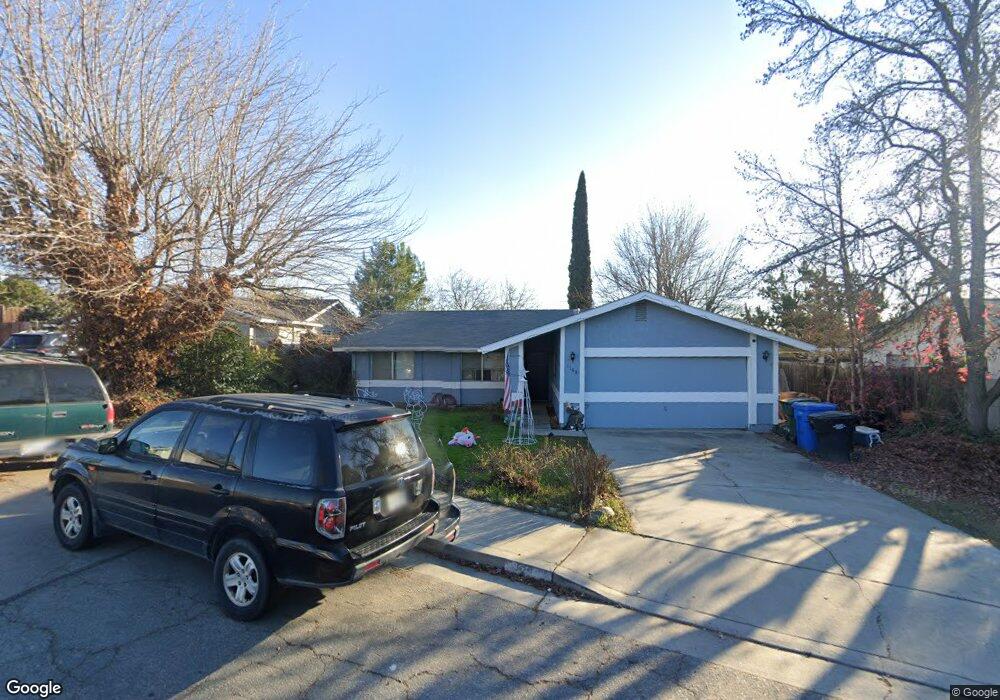
1108 Nanette Ln Paso Robles, CA 93446
Estimated Value: $551,689 - $745,000
3
Beds
2
Baths
1,100
Sq Ft
$571/Sq Ft
Est. Value
About This Home
This home is located at 1108 Nanette Ln, Paso Robles, CA 93446 and is currently estimated at $628,422, approximately $571 per square foot. 1108 Nanette Ln is a home located in San Luis Obispo County with nearby schools including Winifred Pifer Elementary School, Daniel Lewis Middle School, and Paso Robles High School.
Ownership History
Date
Name
Owned For
Owner Type
Purchase Details
Closed on
Aug 8, 2000
Sold by
Roy Edward A and Roy Sandy R
Bought by
Roy Edward A and Roy Sandy R
Current Estimated Value
Home Financials for this Owner
Home Financials are based on the most recent Mortgage that was taken out on this home.
Original Mortgage
$55,000
Outstanding Balance
$19,900
Interest Rate
8.19%
Estimated Equity
$608,522
Purchase Details
Closed on
Jan 31, 1997
Sold by
Griffin Gerald L and Griffin Marietta C
Bought by
Roy Edward A and Roy Sandy R
Create a Home Valuation Report for This Property
The Home Valuation Report is an in-depth analysis detailing your home's value as well as a comparison with similar homes in the area
Home Values in the Area
Average Home Value in this Area
Purchase History
| Date | Buyer | Sale Price | Title Company |
|---|---|---|---|
| Roy Edward A | -- | Cuesta Title Company | |
| Roy Edward A | $105,000 | First American Title Ins Co |
Source: Public Records
Mortgage History
| Date | Status | Borrower | Loan Amount |
|---|---|---|---|
| Open | Roy Edward A | $55,000 |
Source: Public Records
Tax History Compared to Growth
Tax History
| Year | Tax Paid | Tax Assessment Tax Assessment Total Assessment is a certain percentage of the fair market value that is determined by local assessors to be the total taxable value of land and additions on the property. | Land | Improvement |
|---|---|---|---|---|
| 2025 | $1,864 | $170,977 | $81,418 | $89,559 |
| 2024 | $1,833 | $167,625 | $79,822 | $87,803 |
| 2023 | $1,833 | $164,339 | $78,257 | $86,082 |
| 2022 | $1,806 | $161,118 | $76,723 | $84,395 |
| 2021 | $1,775 | $157,960 | $75,219 | $82,741 |
| 2020 | $1,751 | $156,341 | $74,448 | $81,893 |
| 2019 | $1,726 | $153,277 | $72,989 | $80,288 |
| 2018 | $1,703 | $150,272 | $71,558 | $78,714 |
| 2017 | $4,286 | $147,326 | $70,155 | $77,171 |
| 2016 | $4,255 | $144,438 | $68,780 | $75,658 |
| 2015 | $4,204 | $142,269 | $67,747 | $74,522 |
| 2014 | $1,509 | $139,483 | $66,420 | $73,063 |
Source: Public Records
Map
Nearby Homes
- 1024 Rachel Ln
- 1128 Golf Place
- 470 Nickerson Dr
- 225 Lark Dr
- 715 Orchard Dr
- 230 Partridge Ave
- 4 Dove Ct
- 912 Wade Dr
- 915 Moran Ct
- 845 Creston Rd
- 326 Partridge Ave
- 1320 Teal Ave
- 315 Oak Meadow Ln
- 0 Orchard Dr
- 821 Marlbank Place
- 726 N Trigo Ln
- 331 Wild Mustard Ln
- 121 Flag Way Unit C
- 912 Salida Del Sol Dr
- 833 Rolling Hills Rd Unit 16