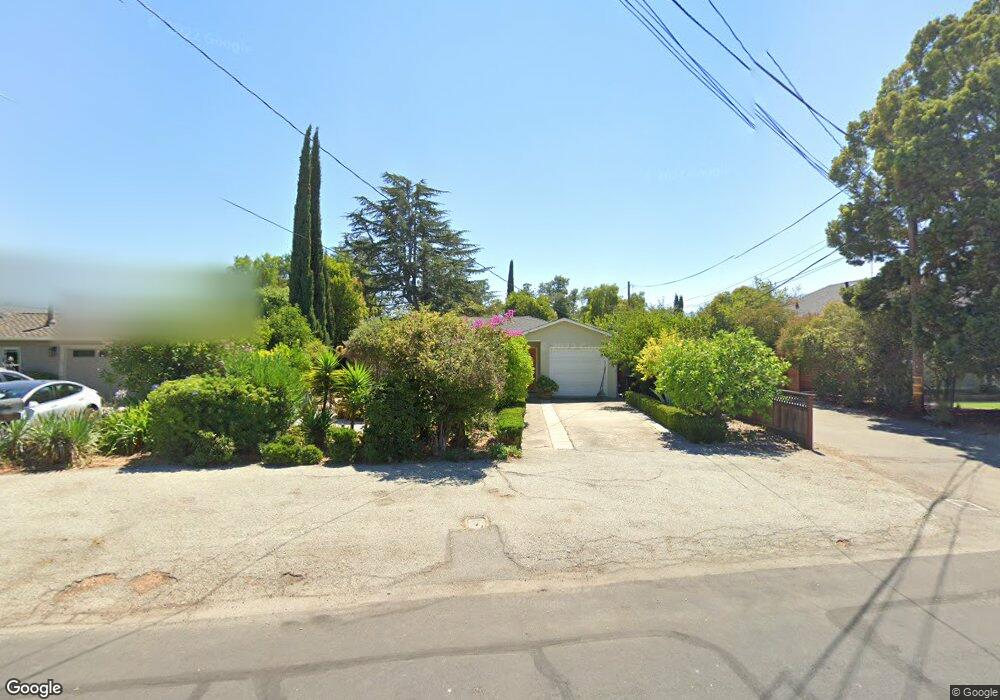
1110 Steinway Ave Campbell, CA 95008
San Tomas NeighborhoodEstimated Value: $1,653,458 - $2,157,000
2
Beds
1
Bath
835
Sq Ft
$2,409/Sq Ft
Est. Value
About This Home
This home is located at 1110 Steinway Ave, Campbell, CA 95008 and is currently estimated at $2,011,615, approximately $2,409 per square foot. 1110 Steinway Ave is a home located in Santa Clara County with nearby schools including Westmont High School, Capri Elementary, and Village School.
Ownership History
Date
Name
Owned For
Owner Type
Purchase Details
Closed on
Oct 27, 2011
Sold by
Ansari Shamsaldin and Ansari Shams
Bought by
Ansari Shamsaldin and Shamsaldin Ansari Trust
Current Estimated Value
Purchase Details
Closed on
Sep 3, 2003
Sold by
Ansari Batoul
Bought by
Ansari Shamsaldin and Ansari Shams
Purchase Details
Closed on
May 7, 2001
Sold by
Ansari Shamsaldin
Bought by
Ansari Shamsaldin and Masnavi Batoul
Create a Home Valuation Report for This Property
The Home Valuation Report is an in-depth analysis detailing your home's value as well as a comparison with similar homes in the area
Home Values in the Area
Average Home Value in this Area
Purchase History
| Date | Buyer | Sale Price | Title Company |
|---|---|---|---|
| Ansari Shamsaldin | -- | None Available | |
| Ansari Shamsaldin | -- | Stewart Title Of California | |
| Ansari Shamsaldin | -- | Stewart Title Of California | |
| Ansari Shamsaldin | -- | Stewart Title Of California | |
| Ansari Shamsaldin | -- | -- |
Source: Public Records
Tax History Compared to Growth
Tax History
| Year | Tax Paid | Tax Assessment Tax Assessment Total Assessment is a certain percentage of the fair market value that is determined by local assessors to be the total taxable value of land and additions on the property. | Land | Improvement |
|---|---|---|---|---|
| 2025 | $4,645 | $312,026 | $270,440 | $41,586 |
| 2024 | $4,645 | $305,909 | $265,138 | $40,771 |
| 2023 | $4,589 | $299,912 | $259,940 | $39,972 |
| 2022 | $4,602 | $294,033 | $254,844 | $39,189 |
| 2021 | $4,502 | $288,269 | $249,848 | $38,421 |
| 2020 | $4,377 | $285,315 | $247,287 | $38,028 |
| 2019 | $4,301 | $279,722 | $242,439 | $37,283 |
| 2018 | $4,164 | $274,238 | $237,686 | $36,552 |
| 2017 | $4,091 | $268,862 | $233,026 | $35,836 |
| 2016 | $3,844 | $263,591 | $228,457 | $35,134 |
| 2015 | $3,758 | $259,633 | $225,026 | $34,607 |
| 2014 | $3,567 | $254,549 | $220,619 | $33,930 |
Source: Public Records
Map
Nearby Homes
- 1170 Steinway Ave
- 1097-1099 W Hacienda Ave
- 915 Bucknam Ave
- 101 Peach Willow Ct
- 14145 Capri Dr
- 615 Chapman Dr
- 1162 Capri Dr
- 1152 Capri Dr
- 668 W Sunnyoaks Ave
- 107 Naramore Ln
- 14225 Lora Dr Unit 90
- 14225 Lora Dr Unit 36
- 14225 Lora Dr Unit 70
- 1329 Elam Ave
- 14375 La Rinconada Dr
- 207 Palmer Dr
- 614 Beta Ct
- 440 W Hacienda Ave
- 112 Mozart Ave
- 875 Emory Ave
- 1100 Steinway Ave
- 1124 Steinway Ave
- 1116 Steinway Ave
- 1054 Steinway Ave
- 1136 Steinway Ave
- 1050 Steinway Ave
- 1120 Steinway Ave
- 1126 Steinway Ave
- 1380 Peggy Ave
- 1046 Steinway Ave
- 1131 Steinway Ave
- 1052 Steinway Ave
- 1109 Steinway Ave
- 1140 Steinway Ave
- 1146 Steinway Ave
- 1370 Peggy Ave
- 1049 Steinway Ave
- 1040 Steinway Ave
- 1115 Audrey Ave
- 1129 Audrey Ave