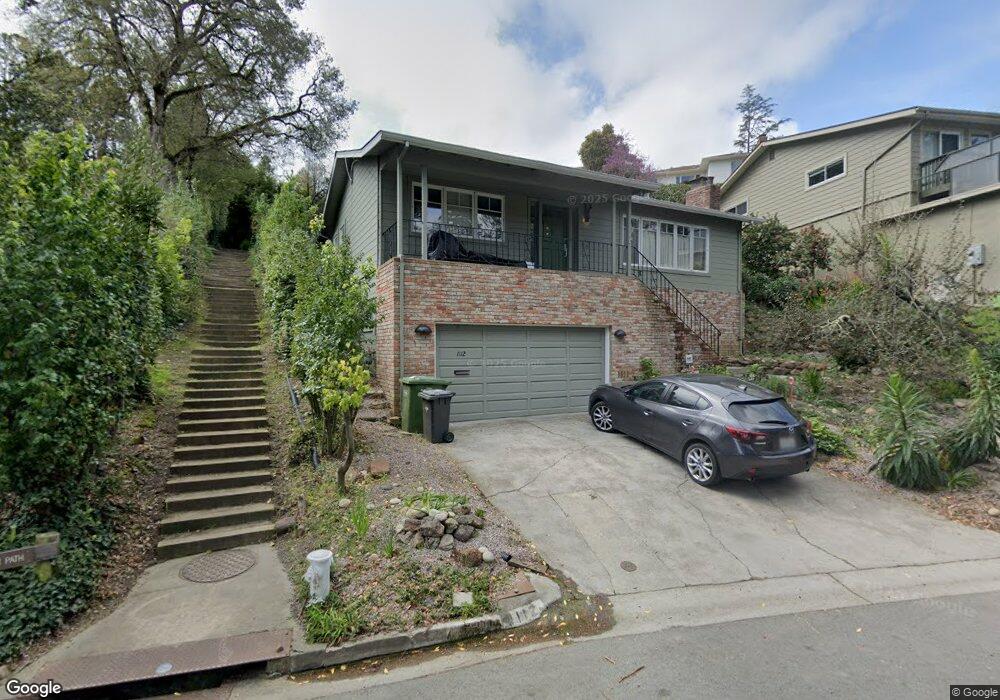
1112 Hillview Rd Berkeley, CA 94708
Berkeley Hills NeighborhoodEstimated Value: $1,238,000 - $1,547,000
3
Beds
2
Baths
1,440
Sq Ft
$979/Sq Ft
Est. Value
About This Home
This home is located at 1112 Hillview Rd, Berkeley, CA 94708 and is currently estimated at $1,409,916, approximately $979 per square foot. 1112 Hillview Rd is a home located in Alameda County with nearby schools including Cragmont Elementary School, Berkeley Arts Magnet at Whittier School, and Washington Elementary School.
Ownership History
Date
Name
Owned For
Owner Type
Purchase Details
Closed on
Oct 3, 2022
Sold by
Tandean Tekno
Bought by
Tekno Tandean Living Trust
Current Estimated Value
Purchase Details
Closed on
Dec 8, 2001
Sold by
Berkhout Lewis A and Berkhout Susan D
Bought by
Tandean Tekno
Home Financials for this Owner
Home Financials are based on the most recent Mortgage that was taken out on this home.
Original Mortgage
$383,200
Interest Rate
6.57%
Purchase Details
Closed on
Nov 30, 1999
Sold by
Childs Alfred W and Childs Eunice M
Bought by
Berkhout Lewis A and Berkhout Susan D
Home Financials for this Owner
Home Financials are based on the most recent Mortgage that was taken out on this home.
Original Mortgage
$348,000
Interest Rate
7.25%
Purchase Details
Closed on
Jun 12, 1996
Sold by
Childs Alfred W and Childs Eunice M
Bought by
Childs Alfred W and Childs Eunice M
Create a Home Valuation Report for This Property
The Home Valuation Report is an in-depth analysis detailing your home's value as well as a comparison with similar homes in the area
Home Values in the Area
Average Home Value in this Area
Purchase History
| Date | Buyer | Sale Price | Title Company |
|---|---|---|---|
| Tekno Tandean Living Trust | -- | -- | |
| Tandean Tekno | $479,000 | Fidelity National Title Co | |
| Berkhout Lewis A | $435,000 | Commonwealth Land Title Co | |
| Childs Alfred W | -- | -- | |
| Childs Alfred W | -- | -- |
Source: Public Records
Mortgage History
| Date | Status | Borrower | Loan Amount |
|---|---|---|---|
| Previous Owner | Tandean Tekno | $383,200 | |
| Previous Owner | Berkhout Lewis A | $348,000 | |
| Closed | Berkhout Lewis A | $43,500 |
Source: Public Records
Tax History
| Year | Tax Paid | Tax Assessment Tax Assessment Total Assessment is a certain percentage of the fair market value that is determined by local assessors to be the total taxable value of land and additions on the property. | Land | Improvement |
|---|---|---|---|---|
| 2025 | $11,131 | $700,578 | $212,273 | $495,305 |
| 2024 | $11,131 | $686,706 | $208,112 | $485,594 |
| 2023 | $10,892 | $680,107 | $204,032 | $476,075 |
| 2022 | $10,685 | $659,771 | $200,031 | $466,740 |
| 2021 | $10,701 | $646,700 | $196,110 | $457,590 |
| 2020 | $10,115 | $646,998 | $194,099 | $452,899 |
| 2019 | $9,702 | $634,315 | $190,294 | $444,021 |
| 2018 | $9,532 | $621,880 | $186,564 | $435,316 |
| 2017 | $9,188 | $609,690 | $182,907 | $426,783 |
| 2016 | $8,882 | $597,738 | $179,321 | $418,417 |
| 2015 | $8,760 | $588,761 | $176,628 | $412,133 |
| 2014 | $8,645 | $577,232 | $173,169 | $404,063 |
Source: Public Records
Map
Nearby Homes
- 1160 Miller Ave
- 1221 Grizzly Peak Blvd
- 1085 Creston Rd
- 1110 Sterling Ave
- 1155 Keeler Ave
- 1024 Grizzly Peak Blvd
- 1165 Cragmont Ave
- 935 Grizzly Peak Blvd
- 1375 Queens Rd
- 1106 Cragmont Ave
- 730 Wildcat Canyon Rd
- 962 Regal Rd
- 2686 Shasta Rd
- 230 Fairlawn Dr
- 1004 Cragmont Ave
- 2501 Rose Walk
- 2315 Eunice St
- 938 San Benito Rd
- 777 Cragmont Ave
- 606 Grizzly Peak Blvd
- 1114 Hillview Rd
- 1119 Woodside Rd
- 1115 Woodside Rd
- 1125 Woodside Rd
- 1100 Hillview Rd
- 1104 Hillview Rd
- 1120 Hillview Rd
- 1141 Woodside Rd
- 1109 Woodside Rd
- 1113 Hillview Rd
- 1115 Hillview Rd
- 1145 Woodside Rd
- 1101 Woodside Rd
- 1111 Hillview Rd
- 1124 Hillview Rd
- 1119 Hillview Rd
- 1120 Woodside Rd
- 1124 Woodside Rd
- 1151 Woodside Rd
- 1112 Woodside Rd
Your Personal Tour Guide
Ask me questions while you tour the home.