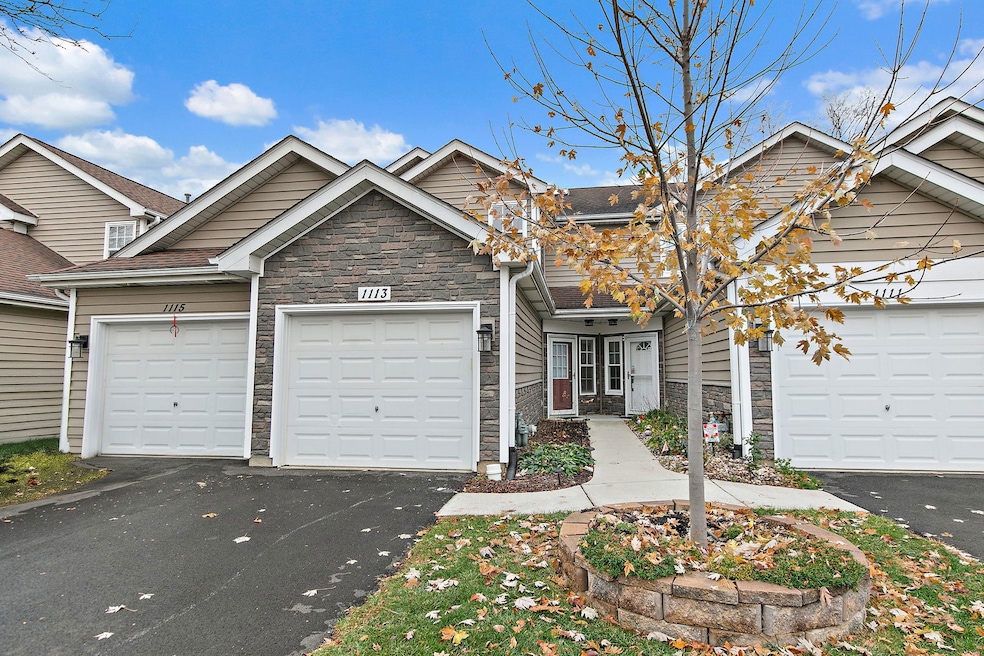

1113 Regency Ct Schaumburg, IL 60193
South Schaumburg NeighborhoodEstimated payment $2,339/month
Highlights
- Walk-In Closet
- Patio
- Central Air
- Nathan Hale Elementary School Rated A-
- Laundry Room
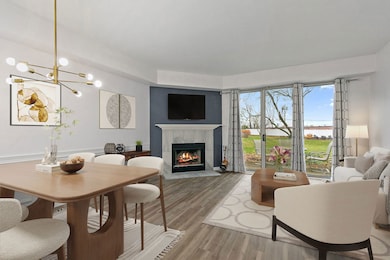
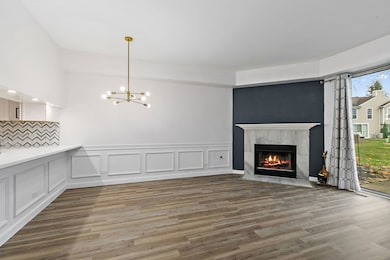
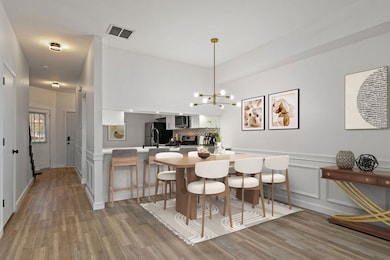
- Combination Dining and Living Room
About This Home
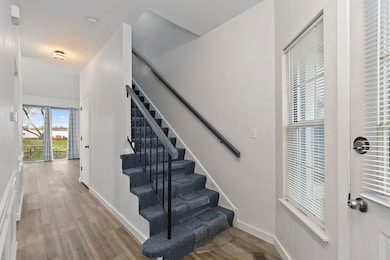
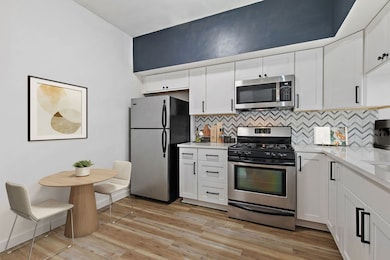
Beautifully updated 2-bedroom townhome in desirable Wellington Court in Schaumburg featuring new luxury vinyl plank flooring throughout the main level and an open-concept floor plan. The bright and spacious living room offers wainscoting and a wood-burning fireplace with a new tile surround, opening to the dining area. The kitchen boasts new white shaker cabinets, quartz counters, a tile backsplash, stainless steel appliances, and a breakfast bar. A convenient main-level powder room and storage under the stairs add functionality. Upstairs, the primary bedroom includes a walk-in closet and an updated en-suite bath with a new vanity, toilet, showerhead, and flooring. The second bedroom also features its own updated en-suite bath, and the second-floor laundry includes new vinyl flooring. Outside, enjoy the patio overlooking picturesque green space. Additional highlights include a one-car attached garage and extra parking in front, all in a prime location close to shopping, restaurants, parks, Metra, and major interstate access-truly a move-in-ready home in an unbeatable location.
Listing Agent
Legacy Properties, A Sarah Leonard Company, LLC License #475122634 Listed on: 11/20/2025
Townhouse Details
Home Type
- Townhome
Est. Annual Taxes
- $5,860
Year Built
- Built in 1990
HOA Fees
- $188 Monthly HOA Fees
Parking
- 1 Car Garage
- Driveway
Home Design
- Entry on the 1st floor
- Asphalt Roof
- Concrete Perimeter Foundation
Interior Spaces
- 1,023 Sq Ft Home
- 2-Story Property
- Ceiling Fan
- Family Room
- Combination Dining and Living Room
Kitchen
- Range
- Microwave
- Dishwasher
Bedrooms and Bathrooms
- 2 Bedrooms
- 2 Potential Bedrooms
- Walk-In Closet
Laundry
- Laundry Room
- Dryer
- Washer
Home Security
Outdoor Features
- Patio
Schools
- Nathan Hale Elementary School
- Jane Addams Junior High School
- Schaumburg High School
Utilities
- Central Air
- Heating System Uses Natural Gas
Community Details
Overview
- Association fees include exterior maintenance, lawn care, snow removal
- 4 Units
- Manager Association, Phone Number (847) 490-3833
- Wellington Court Subdivision
- Property managed by Associa
Pet Policy
- Limit on the number of pets
- Dogs and Cats Allowed
Security
- Carbon Monoxide Detectors
Map
Home Values in the Area
Average Home Value in this Area
Tax History
| Year | Tax Paid | Tax Assessment Tax Assessment Total Assessment is a certain percentage of the fair market value that is determined by local assessors to be the total taxable value of land and additions on the property. | Land | Improvement |
|---|---|---|---|---|
| 2024 | $5,860 | $20,920 | $3,501 | $17,419 |
| 2023 | $5,682 | $20,920 | $3,501 | $17,419 |
| 2022 | $5,682 | $20,920 | $3,501 | $17,419 |
| 2021 | $5,124 | $16,904 | $2,009 | $14,895 |
| 2020 | $5,035 | $16,904 | $2,009 | $14,895 |
| 2019 | $5,035 | $18,783 | $2,009 | $16,774 |
| 2018 | $4,383 | $14,603 | $1,696 | $12,907 |
| 2017 | $4,313 | $14,603 | $1,696 | $12,907 |
| 2016 | $4,034 | $14,603 | $1,696 | $12,907 |
| 2015 | $5,158 | $17,241 | $1,428 | $15,813 |
| 2014 | $5,101 | $17,241 | $1,428 | $15,813 |
| 2013 | $4,971 | $17,241 | $1,428 | $15,813 |
Property History
| Date | Event | Price | List to Sale | Price per Sq Ft |
|---|---|---|---|---|
| 11/20/2025 11/20/25 | For Sale | $315,000 | -- | $308 / Sq Ft |
Purchase History
| Date | Type | Sale Price | Title Company |
|---|---|---|---|
| Warranty Deed | $211,000 | Git | |
| Warranty Deed | $164,000 | Chicago Title Insurance Co | |
| Warranty Deed | $117,500 | -- |
Mortgage History
| Date | Status | Loan Amount | Loan Type |
|---|---|---|---|
| Open | $168,800 | Unknown | |
| Previous Owner | $155,800 | No Value Available | |
| Previous Owner | $103,000 | No Value Available |
Source: Midwest Real Estate Data (MRED)
MLS Number: 12521533
APN: 07-33-104-133-0000
Disclaimer: Certain information contained herein is derived from information provided by parties other than Homes.com. All information provided is deemed reliable, but is not guaranteed to be accurate and should be independently verified.
![]() Based on information submitted to the MLS GRID. All data is obtained from various sources and may not have been verified by broker or MLS GRID. Supplied Open House Information is subject to change without notice. All information should be independently reviewed and verified for accuracy. Properties may or may not be listed by the office/agent presenting the information. Some IDX listings have been excluded from this website.
Based on information submitted to the MLS GRID. All data is obtained from various sources and may not have been verified by broker or MLS GRID. Supplied Open House Information is subject to change without notice. All information should be independently reviewed and verified for accuracy. Properties may or may not be listed by the office/agent presenting the information. Some IDX listings have been excluded from this website.
The Digital Millennium Copyright Act of 1998, 17 U.S.C. § 512 (the “DMCA”) provides recourse for copyright owners who believe that material appearing on the Internet infringes their rights under U.S. copyright law. If you believe in good faith that any content or material made available in connection with our website or services infringes your copyright, you (or your agent) may send us a notice requesting that the content or material be removed, or access to it blocked.
Notices must be sent in writing by email to DMCAnotice@MLSGrid.com.
The DMCA requires that your notice of alleged copyright infringement include the following information:
(1) description of the copyrighted work that is the subject of claimed infringement;
(2) description of the alleged infringing content and information sufficient to permit us to locate the content;
(3) contact information for you, including your address, telephone number and email address;
(4) a statement by you that you have a good faith belief that the content in the manner complained of is not authorized by the copyright owner, or its agent, or by the operation of any law;
(5) a statement by you, signed under penalty of perjury, that the information in the notification is accurate and that you have the authority to enforce the copyrights that are claimed to be infringed; and
(6) a physical or electronic signature of the copyright owner or a person authorized to act on the copyright owner’s behalf. Failure to include all of the above information may result in the delay of the processing of your complaint.
- 1171 Regency Dr
- 1303 Cranbrook Ct
- 738 Crest Ave
- 1229 Cranbrook Dr
- 1126 Tiverton Ct
- 1087 Mohegan Ln
- 1069 Mohegan Ln
- 951 Chelsea Ln
- 823 S Salem Dr
- 829 Pinehurst Ln
- 831 Pinehurst Ln
- 1102 Westover Ln Unit 1C
- 1027 Duxbury Ln
- 1662 Commodore Ct Unit 70294
- 1403 Hampton Ln
- 1467 Fairlane Dr Unit 1B
- 1460 Fairlane Dr Unit 513
- 1460 Fairlane Dr Unit 228
- 1471 Fairlane Dr Unit 2A
- 1000 Webster Ln
- 1171 Regency Dr
- 1151 Regency Ct
- 1523 Bates Ln Unit ID1237885P
- 829 Pinehurst Ln
- 1460 Fairlane Dr Unit 513
- 1665 Commodore Ct Unit 8
- 1463 Mercury Dr Unit 202
- 1463 Mercury Dr Unit 216
- 1735 Chesapeake Ln Unit 7
- 7463 Grant Cir
- 1421 Carolina Ct
- 689 Wilson St
- 1840 Grove Ave Unit 18B184
- 311 Sheffield Ct Unit 1
- 517 Hingham Ln
- 800 S Cedarcrest Dr
- 305 Cambia Dr
- 1220 Kingston Ln
- 7031 Glenwood Ln
- 1934 Heron Ave Unit D
