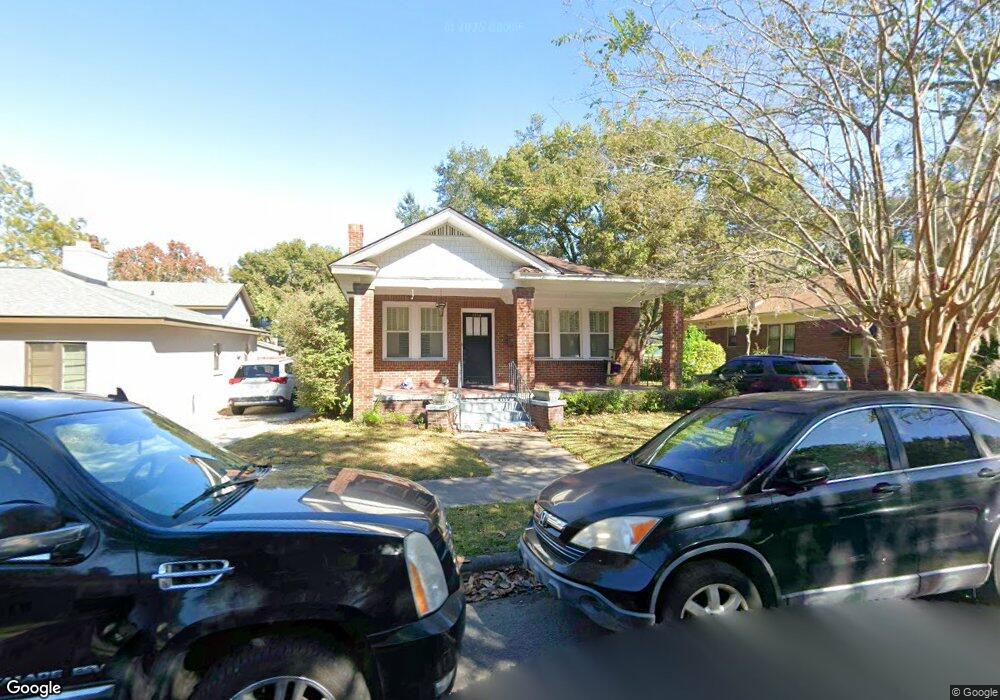
1114 E 51st St Savannah, GA 31404
Parkside NeighborhoodEstimated Value: $458,101 - $508,000
3
Beds
2
Baths
1,363
Sq Ft
$354/Sq Ft
Est. Value
About This Home
This home is located at 1114 E 51st St, Savannah, GA 31404 and is currently estimated at $482,525, approximately $354 per square foot. 1114 E 51st St is a home located in Chatham County with nearby schools including Myers Middle School, Savannah Arts Academy, and Blessed Sacrament School.
Ownership History
Date
Name
Owned For
Owner Type
Purchase Details
Closed on
Apr 30, 2007
Sold by
Not Provided
Bought by
Ellis David W
Current Estimated Value
Home Financials for this Owner
Home Financials are based on the most recent Mortgage that was taken out on this home.
Original Mortgage
$222,741
Outstanding Balance
$135,042
Interest Rate
6.11%
Mortgage Type
VA
Estimated Equity
$347,483
Create a Home Valuation Report for This Property
The Home Valuation Report is an in-depth analysis detailing your home's value as well as a comparison with similar homes in the area
Home Values in the Area
Average Home Value in this Area
Purchase History
| Date | Buyer | Sale Price | Title Company |
|---|---|---|---|
| Ellis David W | $231,000 | -- |
Source: Public Records
Mortgage History
| Date | Status | Borrower | Loan Amount |
|---|---|---|---|
| Open | Ellis David W | $222,741 |
Source: Public Records
Tax History
| Year | Tax Paid | Tax Assessment Tax Assessment Total Assessment is a certain percentage of the fair market value that is determined by local assessors to be the total taxable value of land and additions on the property. | Land | Improvement |
|---|---|---|---|---|
| 2025 | $2,860 | $187,480 | $34,000 | $153,480 |
| 2024 | $22 | $169,240 | $32,000 | $137,240 |
| 2023 | $1,183 | $159,680 | $26,800 | $132,880 |
| 2022 | $2,634 | $123,360 | $24,000 | $99,360 |
| 2021 | $3,896 | $101,440 | $20,200 | $81,240 |
| 2020 | $2,641 | $102,320 | $20,200 | $82,120 |
| 2019 | $3,892 | $102,320 | $20,200 | $82,120 |
| 2018 | $2,502 | $90,000 | $20,200 | $69,800 |
| 2017 | $2,207 | $84,160 | $20,200 | $63,960 |
| 2016 | $2,081 | $77,640 | $20,200 | $57,440 |
| 2015 | $2,770 | $70,840 | $20,160 | $50,680 |
| 2014 | $3,666 | $71,120 | $0 | $0 |
Source: Public Records
Map
Nearby Homes
Your Personal Tour Guide
Ask me questions while you tour the home.