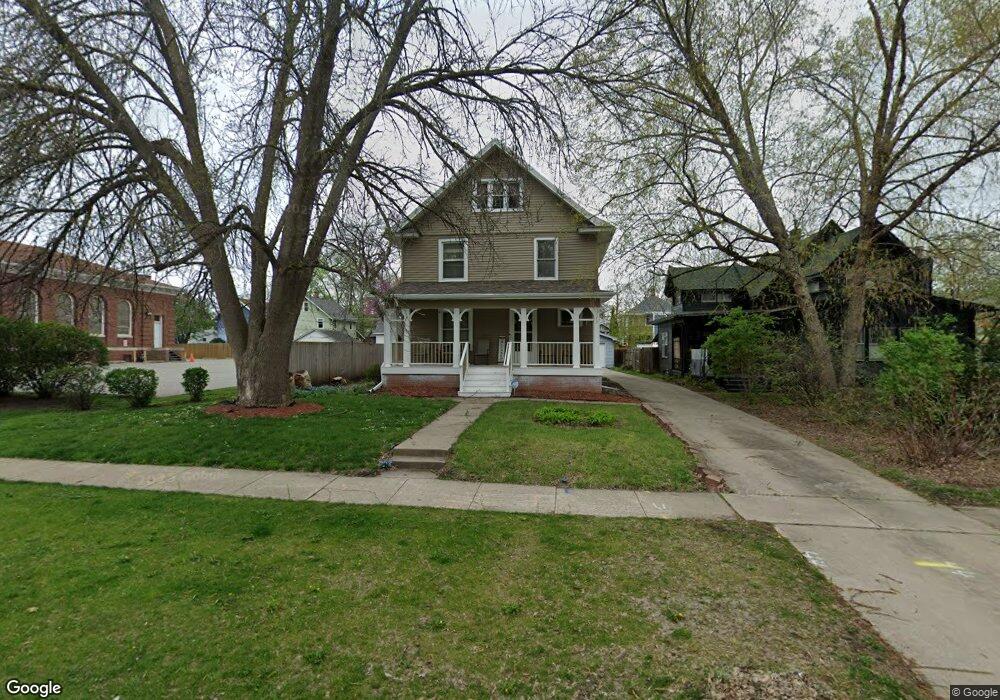
1120 35th St Des Moines, IA 50311
Drake NeighborhoodEstimated Value: $263,000 - $320,000
4
Beds
1
Bath
1,936
Sq Ft
$151/Sq Ft
Est. Value
About This Home
This home is located at 1120 35th St, Des Moines, IA 50311 and is currently estimated at $292,889, approximately $151 per square foot. 1120 35th St is a home located in Polk County with nearby schools including Hubbell Elementary and Roosevelt High School.
Ownership History
Date
Name
Owned For
Owner Type
Purchase Details
Closed on
Mar 15, 2006
Sold by
Clarken Tom and Clarken Stephanie Ann
Bought by
Williams John O and Williams Willa M
Current Estimated Value
Home Financials for this Owner
Home Financials are based on the most recent Mortgage that was taken out on this home.
Original Mortgage
$31,714
Outstanding Balance
$18,092
Interest Rate
6.33%
Mortgage Type
Unknown
Estimated Equity
$274,797
Purchase Details
Closed on
Feb 24, 1998
Sold by
Schooley Patrick J and Schooley Lynn M
Bought by
Clarken Stephanie Ann
Home Financials for this Owner
Home Financials are based on the most recent Mortgage that was taken out on this home.
Original Mortgage
$103,528
Interest Rate
6.95%
Mortgage Type
FHA
Create a Home Valuation Report for This Property
The Home Valuation Report is an in-depth analysis detailing your home's value as well as a comparison with similar homes in the area
Home Values in the Area
Average Home Value in this Area
Purchase History
| Date | Buyer | Sale Price | Title Company |
|---|---|---|---|
| Williams John O | $159,500 | None Available | |
| Clarken Stephanie Ann | $104,500 | -- |
Source: Public Records
Mortgage History
| Date | Status | Borrower | Loan Amount |
|---|---|---|---|
| Open | Williams John O | $31,714 | |
| Open | Williams John O | $132,800 | |
| Previous Owner | Clarken Stephanie Ann | $103,528 |
Source: Public Records
Tax History Compared to Growth
Tax History
| Year | Tax Paid | Tax Assessment Tax Assessment Total Assessment is a certain percentage of the fair market value that is determined by local assessors to be the total taxable value of land and additions on the property. | Land | Improvement |
|---|---|---|---|---|
| 2025 | $5,350 | $310,900 | $54,300 | $256,600 |
| 2024 | $5,350 | $282,400 | $49,100 | $233,300 |
| 2023 | $5,370 | $282,400 | $49,100 | $233,300 |
| 2022 | $5,326 | $236,700 | $43,100 | $193,600 |
| 2021 | $5,070 | $236,700 | $43,100 | $193,600 |
| 2020 | $5,262 | $211,800 | $38,800 | $173,000 |
| 2019 | $4,772 | $211,800 | $38,800 | $173,000 |
| 2018 | $4,718 | $186,100 | $33,700 | $152,400 |
| 2017 | $4,402 | $186,100 | $33,700 | $152,400 |
| 2016 | $4,284 | $171,300 | $30,700 | $140,600 |
| 2015 | $4,284 | $171,300 | $30,700 | $140,600 |
| 2014 | $3,892 | $155,200 | $27,800 | $127,400 |
Source: Public Records
Map
Nearby Homes
- 1144 35th St
- 1148 36th St
- 1070 37th St
- 1242 37th St
- 3821 University Ave
- 1245 34th St
- 1005 38th St
- 1080 31st St
- 3406 School St
- 3101 Cottage Grove Ave
- 1240 32nd St
- 1206 39th St
- 1326 33rd St
- 3827 Carpenter Ave
- 4000 University Ave Unit 7
- 1333 39th St
- 4036 Plainview Dr
- 870 39th St
- 1423 33rd St
- 1008 Kingman Cir
- 1124 35th St
- 0 Adams & 35th St (Wdm)
- 1121 36th St
- 1125 36th St
- 1115 36th St
- 1136 35th St
- 1109 36th St
- 1133 36th St
- 1115 35th St
- 1107 36th St
- 1125 35th St
- 3421 Cottage Grove Ave
- 1137 36th St
- 1103 36th St
- 3419 Cottage Grove Ave
- 1143 36th St
- 1146 35th St
- 3415 Cottage Grove Ave
- 1145 36th St
- 1120 36th St