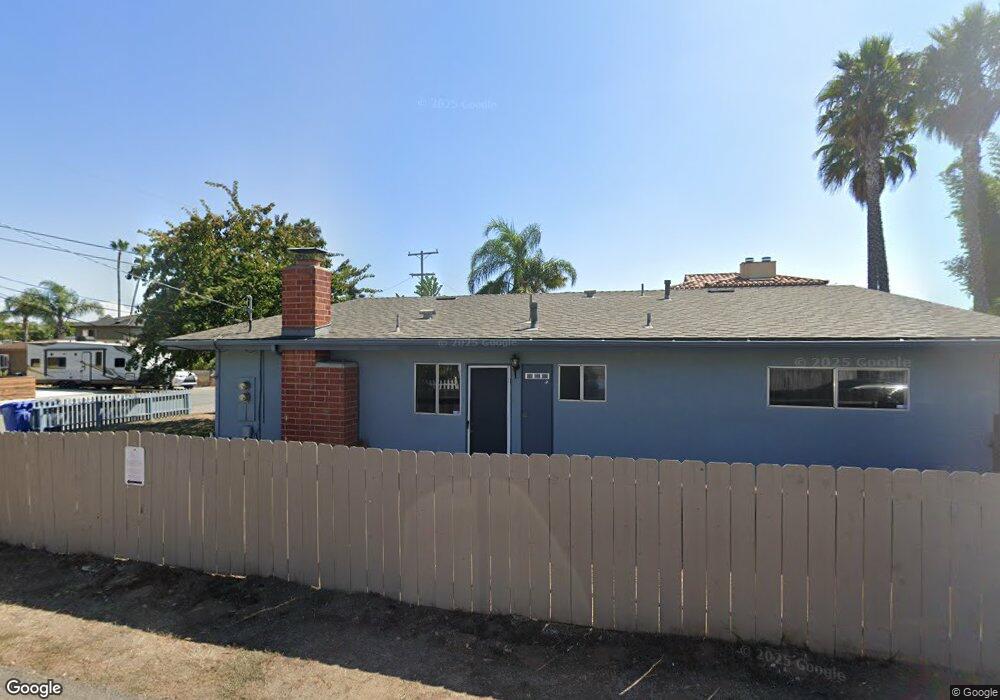
1120 Evergreen Dr Unit 22 Encinitas, CA 92024
Central Encinitas NeighborhoodEstimated Value: $1,475,039 - $3,331,000
4
Beds
2
Baths
1,764
Sq Ft
$1,352/Sq Ft
Est. Value
About This Home
This home is located at 1120 Evergreen Dr Unit 22, Encinitas, CA 92024 and is currently estimated at $2,385,260, approximately $1,352 per square foot. 1120 Evergreen Dr Unit 22 is a home located in San Diego County with nearby schools including Ocean Knoll Elementary School, Oak Crest Middle School, and La Costa Canyon High School.
Ownership History
Date
Name
Owned For
Owner Type
Purchase Details
Closed on
Jul 3, 2003
Sold by
Bennett Timothy Brian and Bennett Amy Hoyt
Bought by
Bennett Timothy Brian and Bennett Amy Hoyt
Current Estimated Value
Purchase Details
Closed on
Jun 25, 1999
Sold by
Hoyt Jennifer and Hoyt Velma W
Bought by
Bennett Timothy B and Bennett Amy Hoyt
Home Financials for this Owner
Home Financials are based on the most recent Mortgage that was taken out on this home.
Original Mortgage
$155,000
Outstanding Balance
$42,059
Interest Rate
7.4%
Estimated Equity
$2,343,201
Purchase Details
Closed on
Aug 14, 1985
Create a Home Valuation Report for This Property
The Home Valuation Report is an in-depth analysis detailing your home's value as well as a comparison with similar homes in the area
Home Values in the Area
Average Home Value in this Area
Purchase History
| Date | Buyer | Sale Price | Title Company |
|---|---|---|---|
| Bennett Timothy Brian | -- | -- | |
| Bennett Timothy B | -- | Fidelity National Title Co | |
| -- | $142,000 | -- |
Source: Public Records
Mortgage History
| Date | Status | Borrower | Loan Amount |
|---|---|---|---|
| Open | Bennett Timothy B | $155,000 |
Source: Public Records
Tax History Compared to Growth
Tax History
| Year | Tax Paid | Tax Assessment Tax Assessment Total Assessment is a certain percentage of the fair market value that is determined by local assessors to be the total taxable value of land and additions on the property. | Land | Improvement |
|---|---|---|---|---|
| 2025 | $5,360 | $411,864 | $194,792 | $217,072 |
| 2024 | $5,360 | $403,789 | $190,973 | $212,816 |
| 2023 | $5,096 | $395,873 | $187,229 | $208,644 |
| 2022 | $5,141 | $388,111 | $183,558 | $204,553 |
| 2021 | $4,908 | $380,502 | $179,959 | $200,543 |
| 2020 | $4,793 | $376,601 | $178,114 | $198,487 |
| 2019 | $4,709 | $369,218 | $174,622 | $194,596 |
| 2018 | $4,611 | $361,980 | $171,199 | $190,781 |
| 2017 | $4,485 | $354,884 | $167,843 | $187,041 |
| 2016 | $4,304 | $347,926 | $164,552 | $183,374 |
| 2015 | $4,213 | $342,701 | $162,081 | $180,620 |
| 2014 | $4,147 | $335,989 | $158,907 | $177,082 |
Source: Public Records
Map
Nearby Homes
- 1129 Bonita Dr
- 1246 Evergreen Dr
- 1341 Caminito Septimo
- 943-45 Bracero Rd
- 943-45 Bracero Rd
- 1320 Evergreen Dr
- 835 Cathy Ln
- 760 Bonita Dr
- 1153 Crest Dr
- 1168 Arcadia Rd
- 1146 E Cove Place
- 930 Gardena Rd
- 147 Witham Rd
- 722 Piedras Oro Calle Unit 6
- 656 Westlake St
- 677 Summer View Cir
- 918 Emma Dr
- 240 Birmingham Dr Unit 19 & 20
- 213 Via Palacio
- 608 Crest Dr
- 1132 Evergreen Dr
- 951 Windy Hill Terrace
- 1110 Evergreen Dr
- 1110 Evergreen Dr
- 1146 Evergreen Dr
- 935 Windy Hill Terrace Unit 37
- 943-45 Windy Hill Terrace
- 1106 Evergreen Dr Unit 8
- 1100 Evergreen Dr
- 1125 Evergreen Dr
- 1135 Evergreen Dr
- 1115 Evergreen Dr
- 1154 Evergreen Dr
- 933 Treasure View Ln
- 943 Windy Hill Terrace
- 1156 Kava Ct
- 1145 Evergreen Dr Unit 47
- 1084 Evergreen Dr
- 1158 Evergreen Dr
- 1089 Evergreen Dr