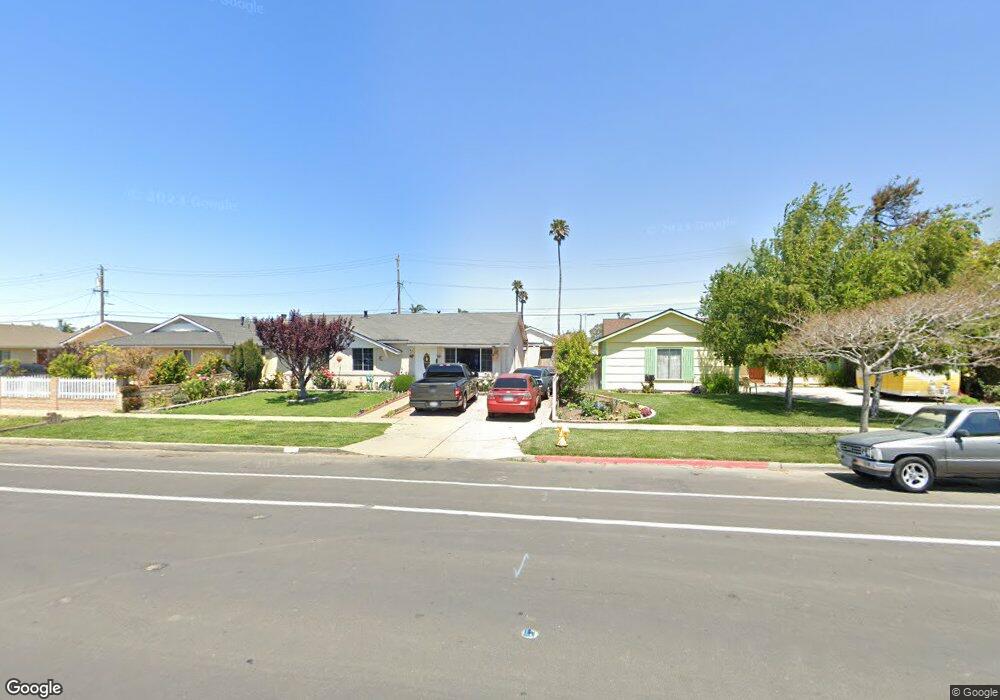
1121 E Cypress Ave Lompoc, CA 93436
Estimated Value: $429,000 - $574,000
3
Beds
2
Baths
1,215
Sq Ft
$423/Sq Ft
Est. Value
About This Home
This home is located at 1121 E Cypress Ave, Lompoc, CA 93436 and is currently estimated at $514,187, approximately $423 per square foot. 1121 E Cypress Ave is a home located in Santa Barbara County with nearby schools including Arthur Hapgood Elementary School, Lompoc Valley Middle School, and Lompoc High School.
Ownership History
Date
Name
Owned For
Owner Type
Purchase Details
Closed on
Nov 27, 2000
Sold by
Pacheco Patrick P and Pacheco Cheryl L
Bought by
Ocampo Nicolas and Ocampo Consuelo
Current Estimated Value
Home Financials for this Owner
Home Financials are based on the most recent Mortgage that was taken out on this home.
Original Mortgage
$151,154
Outstanding Balance
$56,343
Interest Rate
7.86%
Mortgage Type
FHA
Estimated Equity
$457,844
Purchase Details
Closed on
May 9, 1995
Sold by
Bise Paul Alan and Bise Della Marie
Bought by
Pacheco Patrick P and Pacheco Cheryl L
Home Financials for this Owner
Home Financials are based on the most recent Mortgage that was taken out on this home.
Original Mortgage
$116,104
Interest Rate
7.92%
Mortgage Type
FHA
Create a Home Valuation Report for This Property
The Home Valuation Report is an in-depth analysis detailing your home's value as well as a comparison with similar homes in the area
Home Values in the Area
Average Home Value in this Area
Purchase History
| Date | Buyer | Sale Price | Title Company |
|---|---|---|---|
| Ocampo Nicolas | $152,500 | First American Title | |
| Pacheco Patrick P | $117,000 | Chicago Title Company |
Source: Public Records
Mortgage History
| Date | Status | Borrower | Loan Amount |
|---|---|---|---|
| Open | Ocampo Nicolas | $151,154 | |
| Previous Owner | Pacheco Patrick P | $116,104 |
Source: Public Records
Tax History
| Year | Tax Paid | Tax Assessment Tax Assessment Total Assessment is a certain percentage of the fair market value that is determined by local assessors to be the total taxable value of land and additions on the property. | Land | Improvement |
|---|---|---|---|---|
| 2025 | $2,977 | $271,431 | $97,932 | $173,499 |
| 2023 | $2,977 | $260,893 | $94,130 | $166,763 |
| 2022 | $2,925 | $255,779 | $92,285 | $163,494 |
| 2021 | $2,957 | $250,765 | $90,476 | $160,289 |
| 2020 | $2,926 | $248,195 | $89,549 | $158,646 |
| 2019 | $2,878 | $243,330 | $87,794 | $155,536 |
| 2018 | $2,833 | $238,560 | $86,073 | $152,487 |
| 2017 | $2,782 | $233,884 | $84,386 | $149,498 |
| 2016 | $2,732 | $229,299 | $82,732 | $146,567 |
| 2014 | $2,674 | $221,433 | $79,894 | $141,539 |
Source: Public Records
Map
Nearby Homes
- 1200 Peach Ave
- 109 S 3rd St
- 1105 E Olive Ave
- 209 S 7th St
- 1309 E Olive Ave
- 1204 E Walnut Ave Unit B
- 1416 E Walnut Ave
- 240 Quail Cir
- 319 S B St
- 124 Princeton Place
- 321 N Third St
- 205 S E St
- 1725 Autumn Sage Place
- 1741 River Vista Way
- 1744 River Vista Way
- 1742 River Vista Way
- 1740 River Vista Way
- 523 Live Oak Rd
- 535 Live Oak Rd
- 1739 River Vista Way
- 1117 E Cypress Ave
- 1201 E Cypress Ave
- 1205 E Cypress Ave
- 1113 E Cypress Ave
- 1120 Peach Ave
- 1116 Peach Ave
- 1204 Peach Ave
- 1112 Peach Ave
- 1209 E Cypress Ave
- 1109 E Cypress Ave
- 201 S 4th St
- 200 S 4th St
- 1112 E Cypress Ave
- 1208 Peach Ave
- 1108 Peach Ave Unit E
- 1108 Peach Ave
- 1105 E Cypress Ave
- 1213 E Cypress Ave Unit B
- 1204 E Cypress Ave
Your Personal Tour Guide
Ask me questions while you tour the home.