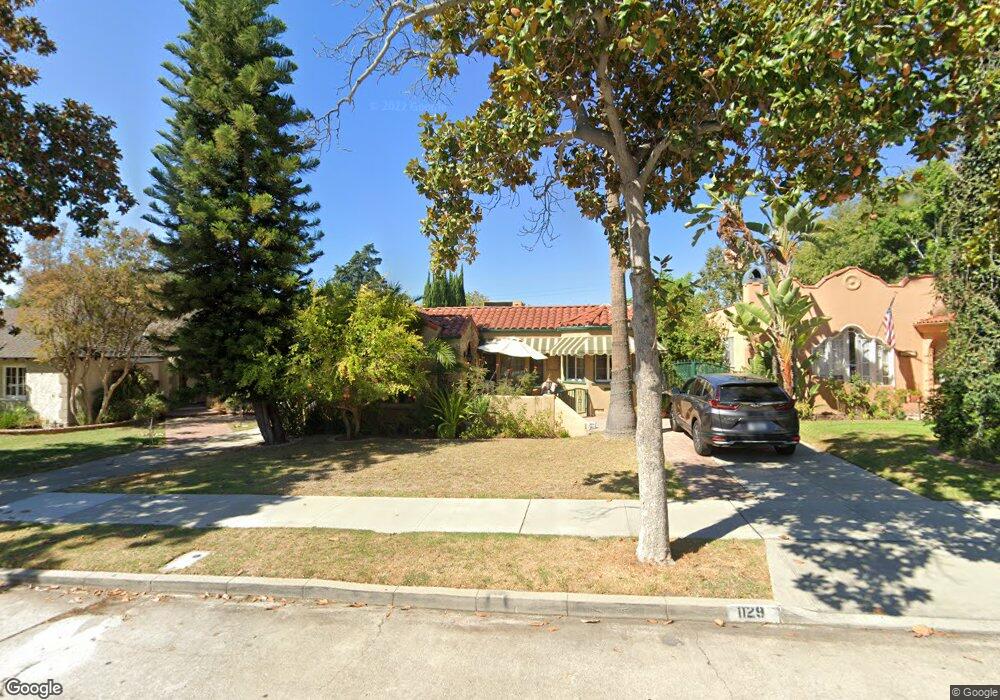
1129 Cordova Ave Glendale, CA 91207
Rossmoyne NeighborhoodEstimated Value: $1,315,000 - $1,504,000
3
Beds
2
Baths
1,524
Sq Ft
$914/Sq Ft
Est. Value
About This Home
This home is located at 1129 Cordova Ave, Glendale, CA 91207 and is currently estimated at $1,392,582, approximately $913 per square foot. 1129 Cordova Ave is a home located in Los Angeles County with nearby schools including R.D. White Elementary School, Woodrow Wilson Middle School, and Glendale High School.
Ownership History
Date
Name
Owned For
Owner Type
Purchase Details
Closed on
Feb 20, 2023
Sold by
Kaprielian Sonia
Bought by
Kaprielian Family Trust and Kaprielian
Current Estimated Value
Purchase Details
Closed on
Feb 23, 2015
Sold by
Kaprielian Hovsep
Bought by
Kaprielian Sonia and Kaprielian Hovsep
Home Financials for this Owner
Home Financials are based on the most recent Mortgage that was taken out on this home.
Original Mortgage
$494,000
Interest Rate
3.6%
Mortgage Type
New Conventional
Purchase Details
Closed on
Jan 28, 2005
Sold by
Kaprielian Hovsep and Kaprielian Sonia
Bought by
Kaprielian Hovsep
Create a Home Valuation Report for This Property
The Home Valuation Report is an in-depth analysis detailing your home's value as well as a comparison with similar homes in the area
Home Values in the Area
Average Home Value in this Area
Purchase History
We collect this data history from publicly available records. To have your information removed, we recommend requesting removal directly through your county’s website.
| Date | Buyer | Sale Price | Title Company |
|---|---|---|---|
| Kaprielian Family Trust | -- | None Listed On Document | |
| Kaprielian Sonia | -- | Timios Inc | |
| Kaprielian Hovsep | -- | -- |
Source: Public Records
Mortgage History
We collect this data history from publicly available records. To have your information removed, we recommend requesting removal directly through your county’s website.
| Date | Status | Borrower | Loan Amount |
|---|---|---|---|
| Previous Owner | Kaprielian Sonia | $494,000 |
Source: Public Records
Tax History
| Year | Tax Paid | Tax Assessment Tax Assessment Total Assessment is a certain percentage of the fair market value that is determined by local assessors to be the total taxable value of land and additions on the property. | Land | Improvement |
|---|---|---|---|---|
| 2025 | $3,641 | $320,448 | $159,245 | $161,203 |
| 2024 | $3,549 | $314,166 | $156,123 | $158,043 |
| 2023 | $3,469 | $308,007 | $153,062 | $154,945 |
| 2022 | $3,406 | $301,968 | $150,061 | $151,907 |
| 2021 | $3,341 | $296,048 | $147,119 | $148,929 |
| 2019 | $3,213 | $287,268 | $142,756 | $144,512 |
| 2018 | $3,131 | $281,636 | $139,957 | $141,679 |
| 2016 | $2,974 | $270,701 | $134,523 | $136,178 |
| 2015 | $2,913 | $266,636 | $132,503 | $134,133 |
| 2014 | $2,894 | $261,414 | $129,908 | $131,506 |
Source: Public Records
Map
Nearby Homes
- 1200 N Cedar St
- 924 E Glenoaks Blvd
- 1234 N Everett St
- 1257 Cordova Ave
- 1117 Viscano Dr
- 1165 N Howard St
- 1317 Sinaloa Dr
- 1334 Carmen Dr
- 1242 N Isabel St
- 415 E Dryden St Unit 101
- 1134 Campbell St Unit 307
- 320 E Stocker St Unit 205
- 411 E Randolph St
- 404 E Randolph St
- 429 Ross St
- 1321 Greenbriar Rd
- 321 E Stocker St Unit 205
- 1122 N Louise St Unit E
- 630 Naranja Dr
- 537 N Adams St Unit 212
- 1125 Cordova Ave
- 1133 Cordova Ave
- 1121 Cordova Ave
- 1137 Cordova Ave
- 1134 N Cedar St
- 1130 N Cedar St
- 1138 N Cedar St
- 1141 Cordova Ave
- 1117 Cordova Ave
- 1126 N Cedar St
- 1140 N Cedar St
- 1128 Cordova Ave
- 1124 Cordova Ave
- 1120 N Cedar St
- 1120 Cordova Ave
- 1113 Cordova Ave
- 1145 Cordova Ave
- 1144 N Cedar St
- 1116 Cordova Ave
- 1136 Cordova Ave
Your Personal Tour Guide
Ask me questions while you tour the home.